Figures & data
Figure 1 Structures of the drug and the copolymer.
Notes: (A) Naringin and (B) PF68.
Abbreviations: EO, ethylene oxide; PF68, pluronic F68; PO, propylene oxide.
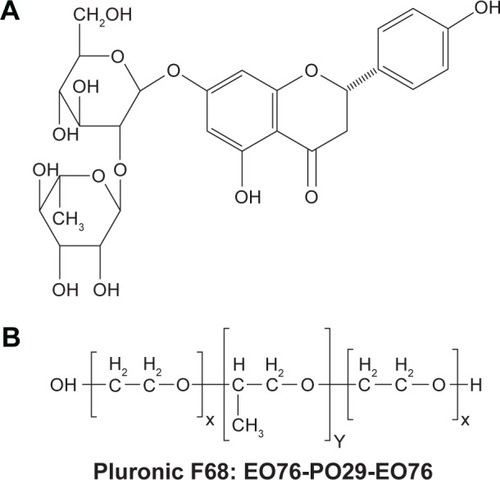
Table 1 Drug entrapment and loading efficiencies at different drug-to-polymer ratios
Figure 2 Size distribution curve of naringin–PF68 micelles.
Abbreviation: PF68, pluronic F68.
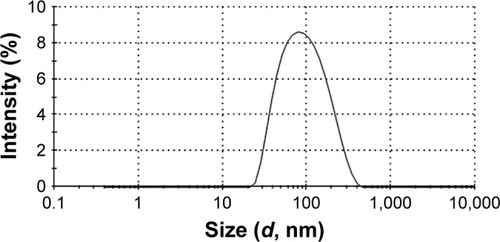
Figure 3 TEM image of naringin–PF68 micelles.
Abbreviations: PF68, pluronic F68; TEM, transmission electron microscope.
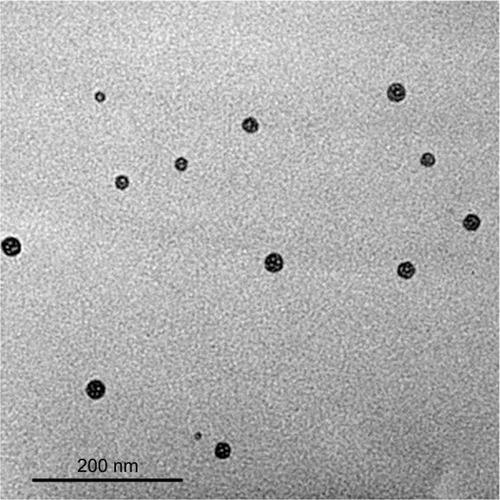
Figure 4 Solid characterization.
Notes: (A) FT-IR spectra, (B) DSC curves, and (C) XRD patterns of (I) naringin, (II) PF68, (III) plain micelles, and (IV) naringin–PF68 micelles.
Abbreviations: PF68, pluronic F68; FT-IR, Fourier transform infrared spectroscopy; DSC, differential scanning colorimetry; XRD, X-ray diffractometry.
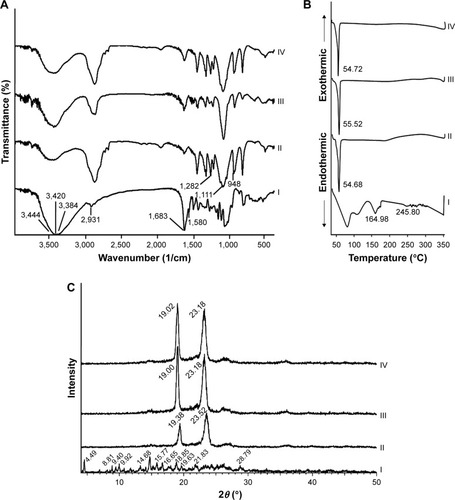
Figure 5 In vitro release of naringin from its micelles with PF68 compared with free drug in different dissolution media at 37°C±0.5°C.
Notes: (A) SGF (pH 1.2) (0–2 h) followed by SIF (pH 6.8) and (B) PBS (pH 7.4). Each point represents the mean ± SD (n=3).
Abbreviations: PF68, pluronic F68; SGF, simulated gastric fluid; SIF, simulated intestinal fluid; PBS, phosphate buffered saline.
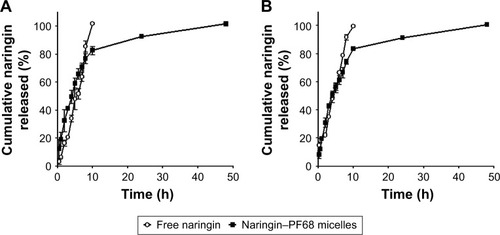
Table 2 Kinetic modeling of drug release data
Table 3 Storage stability of lyophilized naringin micelles at room temperature 25°C±1°C
Table 4 Parameters of macroscopical evaluation of ethanol-induced ulcers in rats
Figure 6 Gross appearance of stomach tissues.
Notes: (A) Normal control with normal gastric mucosa, (B) positive control showing multiple gastric ulcers and intensely hemorrhagic mucosa, (C) rats pretreated with naringin (100 mg/kg) displaying some gastric ulcers and moderately hemorrhagic mucosa, and rats pretreated with either (D) naringin (200 mg/kg) or (E) naringin–PF68 micelles (100 mg/kg) showing minimal gastric ulcers and mildly hemorrhagic mucosa. Arrows indicate gastric ulcers and hemorrhagic mucosa.
Abbreviation: PF68, pluronic F68.
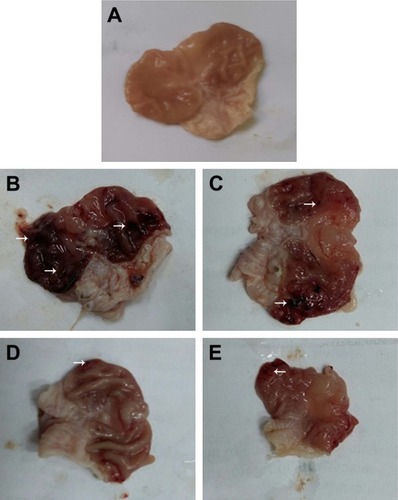
Figure 7 Histological examination (HE, 100×) of rats stomach.
Notes: (A) Normal control showing normal gastric mucosa (arrow) and submucosa (arrow head), (B) positive control with coagulative necrosis of entire mucosal thickness with intense hemorrhage and desquamation of necrotic glandular epithelium (arrow) as well as congestion of blood vessels, severe edema, and neutrophilic infiltrations in the submucosa (arrow head), (C) orally pretreated with naringin (100 mg/kg) showing coagulative necrosis of luminal half of the gastric mucosa with hemorrhage and desquamation of necrotic glandular epithelium (arrow) as well as severe edema (arrow head) and neutrophilic infiltrations in the submucosa, and orally pretreated with either (D) naringin (200 mg/kg) or (E) naringin–PF68 micelles (100 mg/kg) displaying coagulative necrosis of only superficial layer of gastric mucosa (arrow) and mild desquamation of necrotic glandular epithelium, besides mild edema and neutrophilic infiltrations in the submucosa (arrow head).
Abbreviations: HE, hematoxylin and eosin; PF68, pluronic F68.
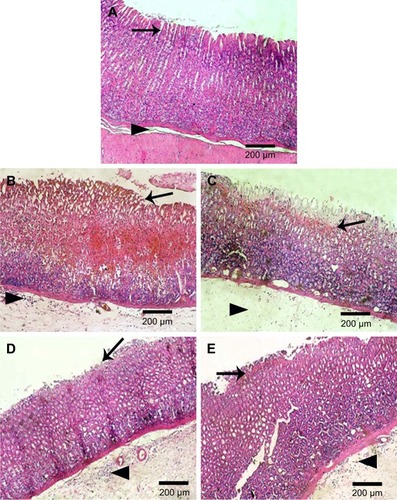
Figure 8 Microphotographs of gastric tissue of rats using immunohistochemical staining for (A) TNF-α and (B) caspase-3 in comparison with normal and positive control groups (IHC, 100×).
Notes: (I) Normal control displaying minimal brown-stained gastric mucosal epithelium (arrow), (II) positive control showing intense brown staining in gastric mucosal epithelium (arrow), gastric glands, and submucosa (arrow head), (III) rats orally pretreated with naringin (100 mg/kg) showing moderate brown staining of the gastric mucosal epithelium (arrow), gastric glands, and submucosa (arrow head), and orally pretreated with either (IV) naringin (200 mg/kg) or (V) naringin–PF68 micelles (100 mg/kg) displaying mild brown staining of superficial gastric mucosal epithelium (arrow) and gastric glands and submucosa (arrow head).
Abbreviations: IHC, immunohistochemical; PF68, pluronic F68; TNF-α, tumor necrosis factor-alpha.
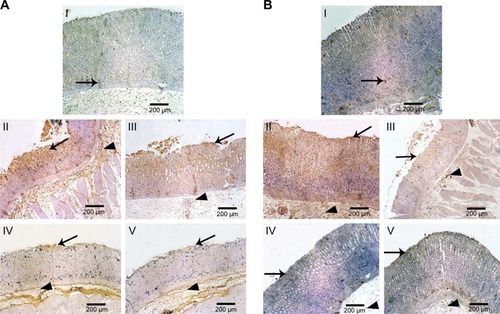
Figure 9 Effects of naringin oral pretreatment on ethanol-induced increase of gastric expression of TNF-α and caspase-3 in rats in comparison with normal and positive control groups (IHC, 100×).
Notes: (A) TNF-α and (B) caspase-3. Data are mean ± SD, n=6. ***P<0.001 vs normal control group. #P<0.05 and ###P<0.001 vs positive control group. $$P<0.01, and $$$P<0.001 vs 100 mg/kg naringin pretreated group.
Abbreviations: IHC, immunohistochemical; PF68, pluronic F68; TNF-α, tumor necrosis factor-alpha.
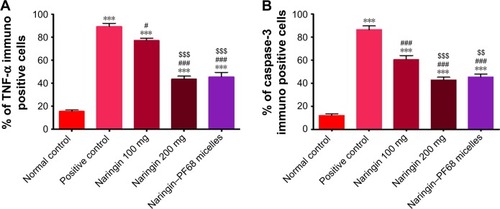
Figure 10 Effects of naringin oral pretreatment on ethanol-induced changes in oxidative stress markers.
Notes: (A) MDA, (B) GSH, and (C) SOD in comparison with normal and positive control groups. Data are mean ± SD, n=6. ***P<0.001 vs normal control group. ##P<0.01, and ###P<0.001 vs positive control group. $P<0.05 and $$P<0.01 vs 100 mg/kg naringin pretreated group.
Abbreviations: GSH, reduced glutathione; MDA, malondialdehyde; PF68, pluronic F68; SOD, superoxide dismutase.
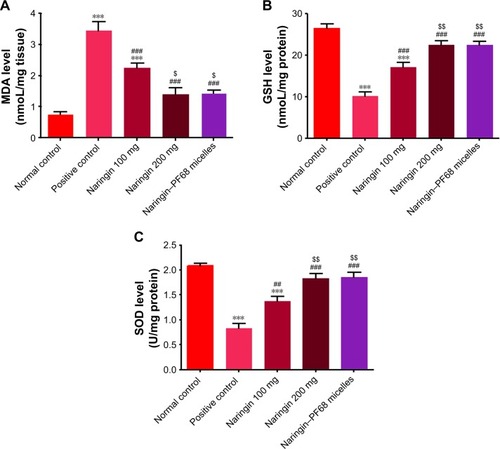
Figure 11 Effects of naringin oral pretreatment on ethanol-induced cytokines expression in comparison with normal and positive control groups using ELISA.
Notes: (A) NF-κB and (B) IL-6. Data are mean ± SD, n=6. **P<0.01, and ***P<0.001 vs normal control group. #P<0.05 and ###P<0.001 vs positive control group. $P<0.05 vs 100 mg/kg naringin pretreated group.
Abbreviations: ELISA, enzyme-linked immunosorbent assay; IL-6, interleukin-6; NF-κB, nuclear factor kappa-light-chain-enhancer of activated B cells; PF68, pluronic F68.
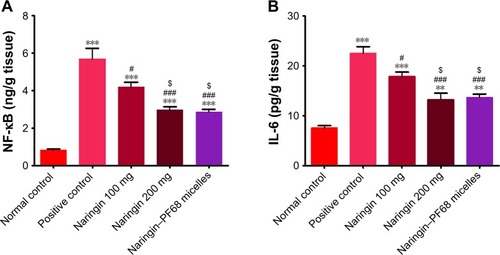
Table 5 The in vitro cytotoxicity estimated as the IC50 values after 72 h
Table 6 Effects of micelled naringin (100 mg/kg) on tumor growth in mice-bearing EAC cells in comparison with cisplatin (1 mg/kg) and free naringin (100 mg/kg)
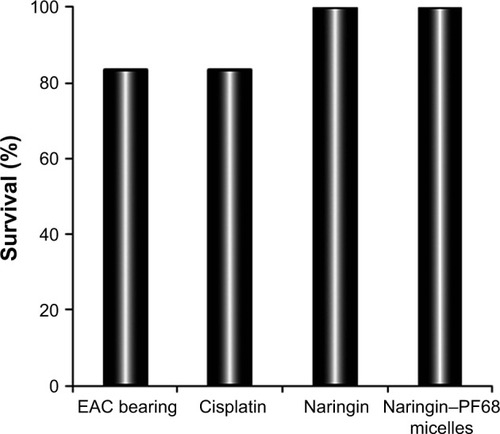
Figure 12 Survival (%) of mice of different groups at the end of tumor growth study.
Abbreviations: EAC, Ehrlich ascites carcinoma; PF68, pluronic F68.