Figures & data
Figure 1 AFM-based force spectroscopy experiments and force–distance curve.
Notes: (A) Schematic representation of the erythrocytes deposited on a poly-L-lysine-coated glass slide and an AFM tip chemically functionalized with different fibrinogen variants. The vertical movement approaching the tip to the sample until contact enables the binding of fibrinogen to the erythrocyte. The subsequent retraction progresses until a certain force (and distance) is reached and the fibrinogen molecule detaches from the erythrocyte surface. The (un)binding frequency corresponds to the fraction of these approach–retraction cycles in which binding and subsequent unbinding occur. (B) Example of a force–distance curve. When approaching the tip to the sample (red line), the fibrinogen molecule may contact with cell receptor(s) and the binding between them can occur. By retracting the tip away from the sample (blue line), as the cantilever moves upward, the tip bends down to negative force values. In some surface distance point, the bond breaks and the cantilever jumps back to its neutral force position. At this point, the binding force necessary to break the bond, at the fibrinogen single-molecule level, can be measured.
Abbreviation: AFM, atomic force microscopy.
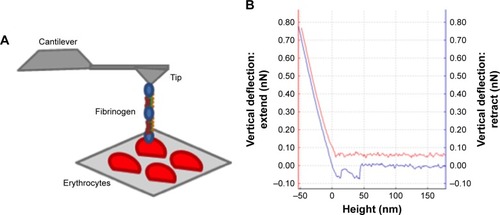
Figure 2 AFM force spectroscopy data for the binding between different fibrinogen variants and erythrocytes.
Notes: (A) Rupture force histograms of the interactions between the three different fibrinogen mutants (D97E, D574E and D97E/D574E: light gray) or WT fibrinogen (dark gray) and erythrocytes. On the rupture force histograms, each count represents a single-molecule binding between one fibrinogen molecule and one of its cell receptors. (B) Average (un)binding force of the interactions. Values are shown as mean ± standard error of mean (SEM). There were statistically significant variations (***p<0.0001) of the rupture forces between WT fibrinogen and the three fibrinogen variants with mutations on the Aα chain (D97E, D574E and D97E/D574E). (C) Variation of the fibrinogen–erythrocyte (un)binding frequency of the different fibrinogen variants relative to WT fibrinogen. (Un)binding frequency variations were calculated based on the ratio between the frequency of (un)binding events determined for the fibrinogen mutants and the frequency of (un)binding events obtained for WT fibrinogen.
Abbreviations: AFM, atomic force microscopy; WT, wild-type.
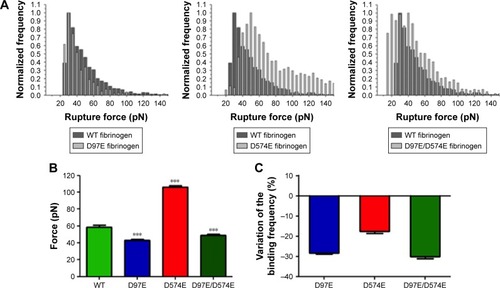
Figure 3 Clots made from WT (A–C) or D97E (D–F) fibrinogen (0.5 mg/mL), imaged by scanning electron microscopy.
Notes: Magnifications: A, D, 5,000×; B, E, 25,000×; C, F, 50,000×.
Abbreviation: WT, wild-type.
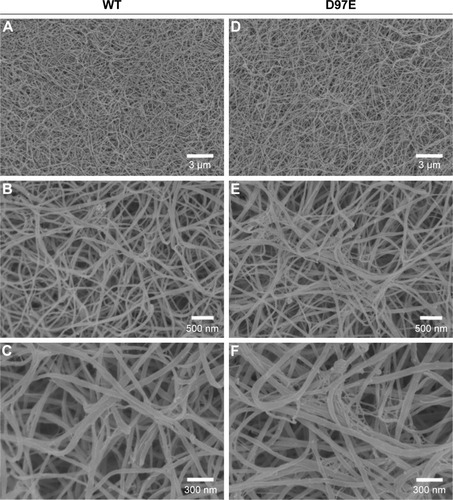
Figure 4 Fibrin clots formed in the presence of erythrocytes (20%), with WT (A–C) or D97E (D–F) fibrinogen, imaged by scanning electron microscopy.
Notes: Magnifications: A, D, 5,000×; B, E, 25,000×; C, F, 50,000×.
Abbreviation: WT, wild-type.
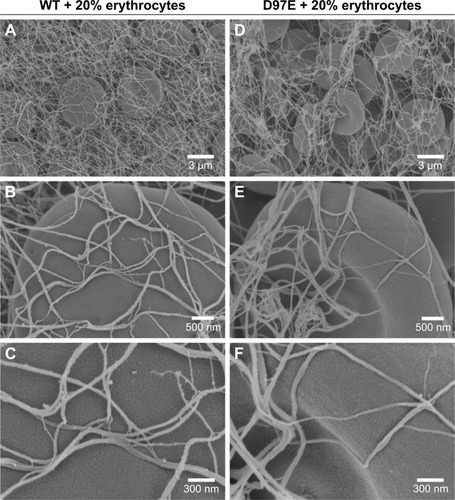
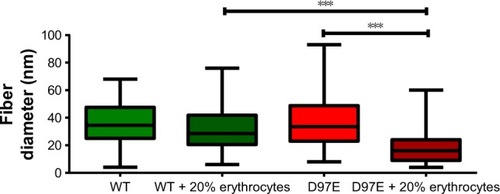
Figure 5 Diameter of fibers from WT or D97E fibrin clots, in the absence or presence of erythrocytes.
Notes: Data are presented as a box-and-whiskers plot. Fiber diameters were measured from 20 random fibers from each condition, imaged with 25,000× magnification (***p<0.0001).
Abbreviation: WT, wild-type.