Figures & data
Figure 1 Chemical structure of andrographolide.
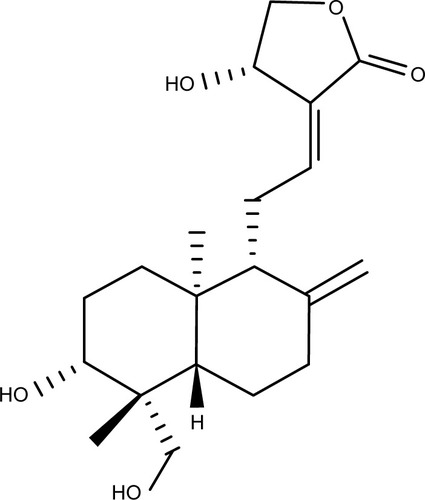
Figure 2 Solubility tests of andrographolide in different vehicles. Results were expressed as mean ± standard deviation (n=3). *Significantly different compared with the water group at p<0.05.
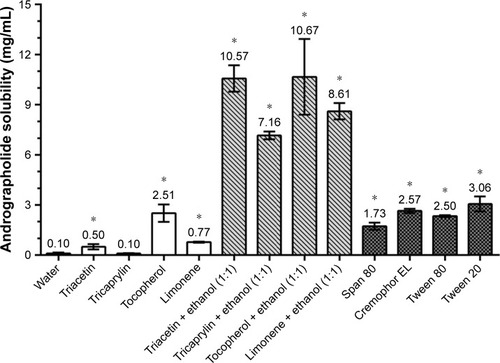
Table 1 Composition and characterization of various AG-NE formulations
Figure 3 (A) Size distribution of the optimized andrographolide-loaded nanoemulsion (AG-NE) droplets determined by photon correlation spectroscopy. (B) Transmission electron microscopy image of the AG-NE.
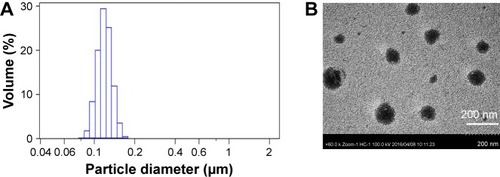
Table 2 AG content, AG remained, and droplet size of the optimized AG-NE (F2) stored at 4°C and 25°C over a period of 90 days
Figure 4 High-performance liquid chromatograms of (A) blank rat plasma, (B) standard andrographolide solution (0.5 μg/mL) and internal standard (ISTD) solution spiked with blank rat plasma, and (C) rat plasma sample at 5 min after oral administration of 100 mg/kg andrographolide-loaded nanoemulsion. Peak identification: (1): 10 μg/mL ISTD and (2): andrographolide.
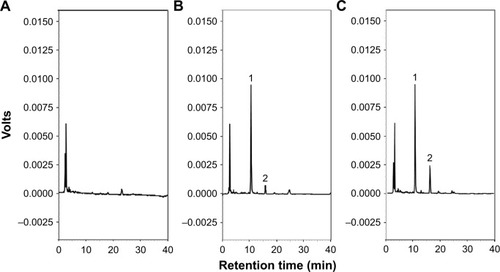
Figure 5 Concentration of andrographolide (AG) in AG suspension, AG ethanol solution, and the optimized andrographolide-loaded nanoemulsion (AG-NE) groups of different small intestine regions after incubation in AG solution (50 μg/mL) at 37°C for 1 h. Results were expressed as mean ± standard deviation (n=3). Different letters (a–d) indicate a significant difference at p<0.05.
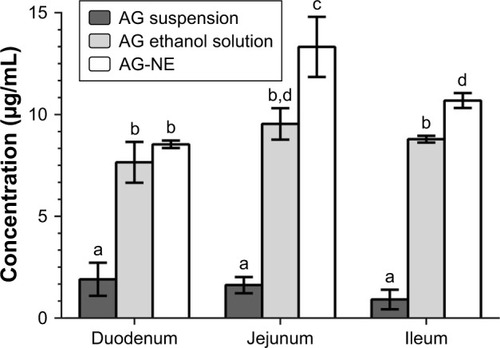
Table 3 Pharmacokinetic parameters of AG after intravenous administration of AG solution and after oral administration of AG suspension and the optimized AG-NE in male rats
Figure 6 The plasma concentrations–time profiles of andrographolide (AG) after drug administration of AG solution (5 mg/kg, intravenous [IV] injection), AG suspension (300 mg/kg, PO), and the optimized andrographolide-loaded nanoemulsion (AG-NE) (100 mg/kg, PO) in rats. Results expressed as mean ± standard deviation (n=6).
Abbreviation: PO, oral administration.
![Figure 6 The plasma concentrations–time profiles of andrographolide (AG) after drug administration of AG solution (5 mg/kg, intravenous [IV] injection), AG suspension (300 mg/kg, PO), and the optimized andrographolide-loaded nanoemulsion (AG-NE) (100 mg/kg, PO) in rats. Results expressed as mean ± standard deviation (n=6).Abbreviation: PO, oral administration.](/cms/asset/b88f5d62-2863-4633-9d65-b0d823812b71/dijn_a_154824_f0006_b.jpg)
Figure 7 Effects of pre-treatment with blank suspension, andrographolide (AG) suspension, blank nanoemulsion (NE), and the optimized andrographolide-loaded nanoemulsion (AG-NE) on (A) ulcer index in the intestinal mucosa and (B) histological damage score of mice on its indomethacin-induced intestinal lesions. Group I: sham group; Others were pretreated with formulation by oral administration 1 h before treatment with indomethacin as follows: Group II was pretreated with blank suspension; group III was pretreated with AG suspension (300 mg/kg); group IV was pretreated with blank NE; and group V was pretreated with AG-NE (100 mg/kg). Results were expressed as mean ± standard deviation (n=4). Different letters (a–d) indicate a significant difference at p<0.05.
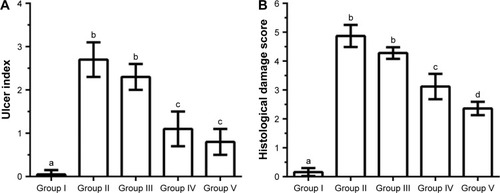
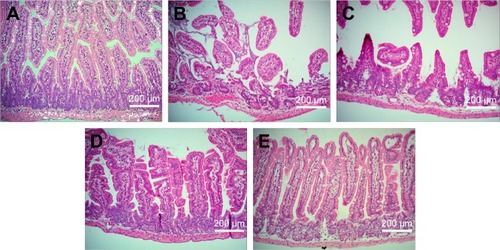
Figure 8 Representative images of small intestines. (A) The sham group and effect of pretreatment with (B) blank suspension, (C) andrographolide suspension, (D) blank nanoemulsion, and (E) the optimized andrographolide-loaded nanoemulsion by oral administration 1 h before treatment with indomethacin on histological appearance of indomethacin-induced small intestine lesions in mice (original magnification ×200).