Figures & data
Figure 1 Schematic of the modified coaxial system (A) and the designed SCs with shellac nanocoating (B).
Abbreviations: DS, diclofenac sodium; PVP, polyvinylpyrrolidone; SCs, structural nanocomposites.
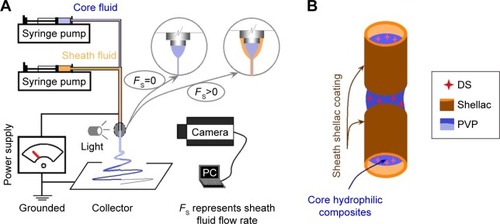
Figure 2 Implementations of the electrospinning processes.
Notes: (A) The whole electrospinning system. Inset shows the homemade coaxial spinneret; (B) the connections of spinneret with the syringes; (C) linkage of spinneret with the power supply; (D1 and D2) typical images of the single-fluid blending electrospinning process and Taylor cone for preparing HC, respectively; and (E1 and E2) typical images of the modified coaxial electrospinning process for fabricating SC.
Abbreviations: HC, hydrophilic nanocomposites; SC, structural nanocomposite.
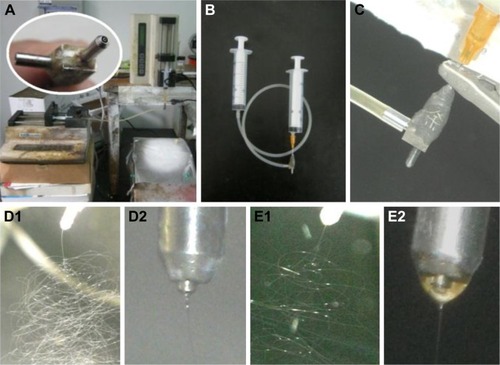
Figure 3 Scanning electron microscopy images of the surface morphologies of F1 (A) and F2 nanofibers (B) and the cross sections of F1 (C) and F2 (D), respectively.
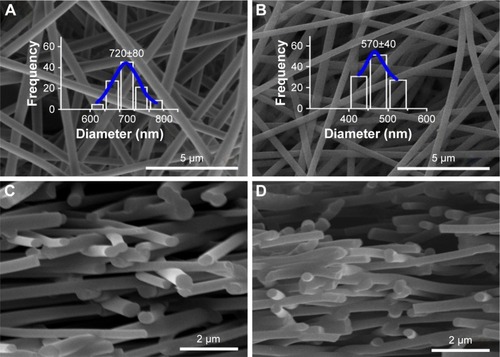
Figure 4 Transmission electron microscopy images of F1 (A) and F2 nanofibers (B).
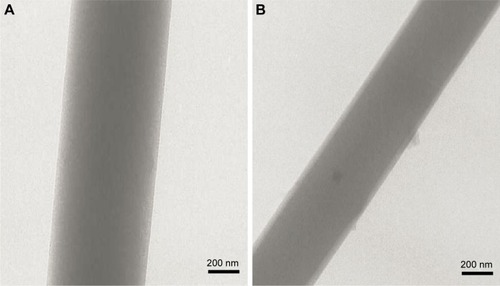
Figure 5 X-ray diffraction patterns.
Abbreviations: DS, diclofenac sodium; PVP, polyvinylpyrrolidone.
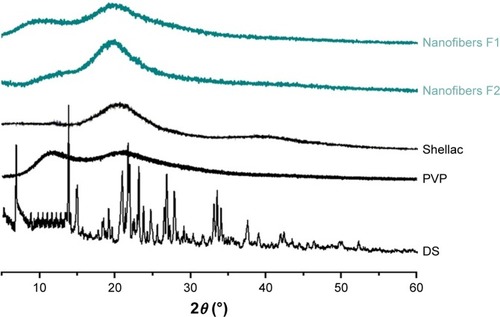
Figure 6 ATR-FTIR spectra and the molecular formula of components.
Abbreviations: ATR-FTIR, attenuated total reflectance-Fourier transform infrared; DS, diclofenac sodium; PVP, polyvinylpyrrolidone.
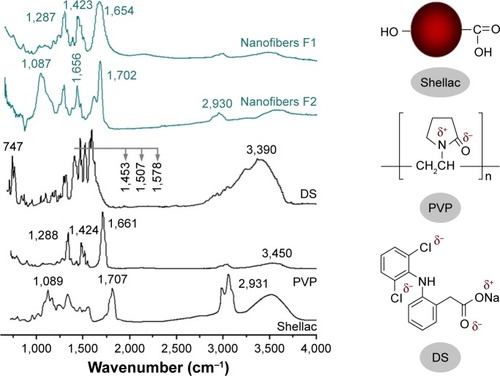
Figure 7 WCAs of HC (F1 nanofibers) and SC (F2 nanofibers) using droplets with different pH values.
Abbreviations: HC, hydrophilic nanocomposites; SC, structural nanocomposite; WCA, water contact angle.
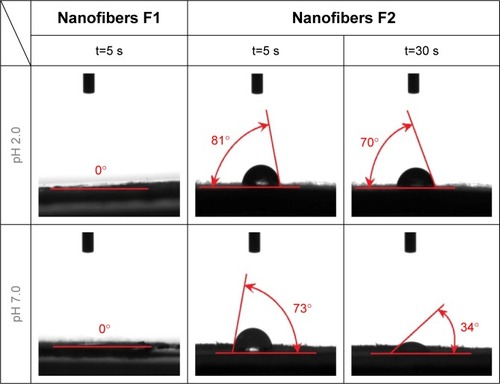
Figure 8 In vitro drug dissolution from the composites and raw DS particles.
Abbreviation: DS, diclofenac sodium.
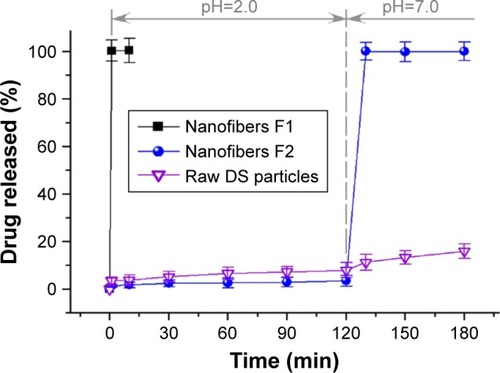
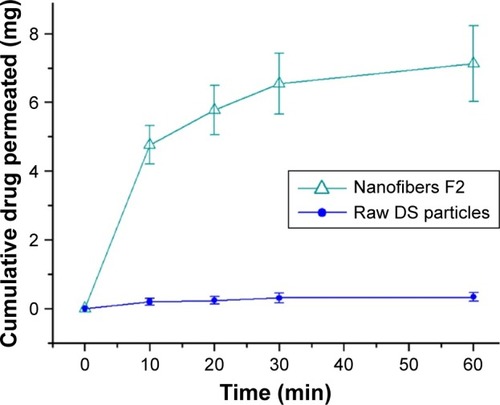
Figure 9 Ex vivo permeation profiles of SC and raw DS particles.
Abbreviations: DS, diclofenac sodium; SC, structural nanocomposite.