Figures & data
Figure 1 Bright field confocal images of RWM in the x-y-z scanning mode (A). SEM images of RWM (B).
Abbreviations: RWM, round window membrane; SEM, scanning electron microscope; OE, outer epithelium layer; CT, connective tissue; IE, inner epithelium layer.
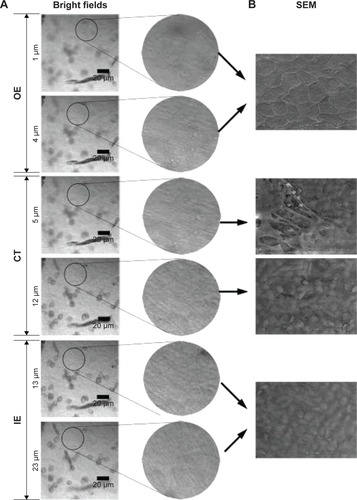
Figure 2 CLSM of RWM after intratympanic injection of PLGA NPs. (A) CLSM series images of RWM by the z-axis scanning model at 1-µm vertical intervals from middle ear side to scala tympanic side. DAPI-stained cell nuclei are seen in blue and PLGA NPs are seen in green. (B) Three-dimensional reconstruction image of RWM obtained from successive z-stacks. The green dots represent PLGA NPs. (C) Fluorescence intensity of the planar cross-sections of RWM from middle ear side to inner ear side of RWM with a step size of 1 µm.
Abbreviations: CLSM, confocal laser scanning microscope; RWM, round window membrane; PLGA NPs, poly (lactic-co-glycolic acid) nanoparticles; DAPI, 4′,6-diamidino-2-phenylindole; OE, outer epithelium layer; CT, connective tissue; IE, inner epithelium layer.
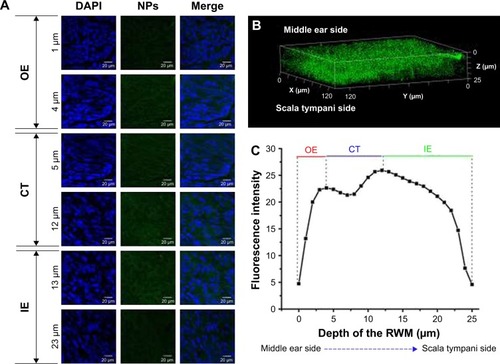
Figure 3 TEM image of PLGA NPs (A). TEM images of perilymph in the experimental group after intratympanic injection of PLGA NPs for 30 minutes (B) and blank group (C).
Abbreviations: TEM, transmission electron microscope; PLGA NPs, poly (lactic-co-glycolic acid) nanoparticles.
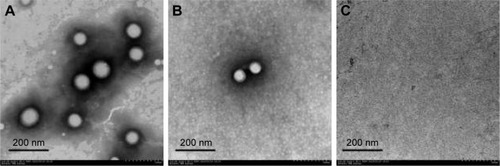
Figure 4 CLSM of RWM as a function of administration time. (A) CLSM micrographs of outer epithelium cells of RWM after intratympanic injection of 0.1 mL of 90 mg/mL PLGA NPs for 10, 30, and 60 minutes. DAPI-stained cell nuclei are blue and PLGA NPs are green. (B) Coumarin-6 fluorescence intensity of RWM at different distances along the z-axis from middle ear side to inner ear side. Three-dimensional reconstruction images of RWM obtained from successive z-stacks after intratympanic injection of NPs for 10 minutes (C), 30 minutes (D), and 60 minutes (E).
Abbreviations: CLSM, confocal laser scanning microscope; RWM, round window membrane; DAPI, 4′,6-diamidino-2-phenylindole; PLGA NPs, poly (lactic-co-glycolic acid) nanoparticles.
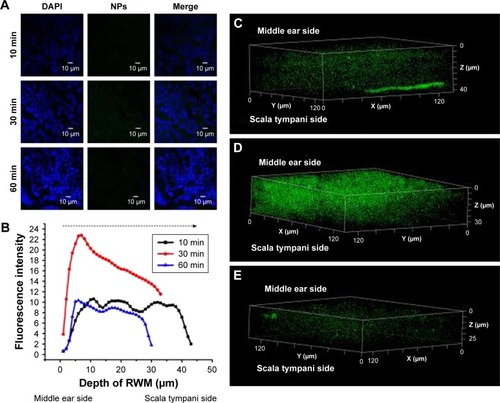
Figure 5 CLSM of RWM as a function of concentration. (A) CLSM micrographs of outer epithelium cells of RWM after intratympanic injection of 0.1 mL of 10, 30, and 90 mg/mL PLGA NPs for 30 minutes. (B) Coumarin-6 fluorescence intensities in the cross-section of RWM along the z-axis with 1-µm vertical intervals after intratympanic injection of PLGA NPs at different concentrations for 30 minutes. Three-dimensional reconstruction images of RWM obtained from successive z-stacks after intratympanic injection of 10 mg/mL (C), 30 mg/mL (D), and 90 mg/mL (E) PLGA NPs for 30 minutes.
Abbreviations: CLSM, confocal laser scanning microscope; RWM, round window membrane; DAPI, 4′,6-diamidino-2-phenylindole; PLGA NPs, poly (lactic-co-glycolic acid) nanoparticles.
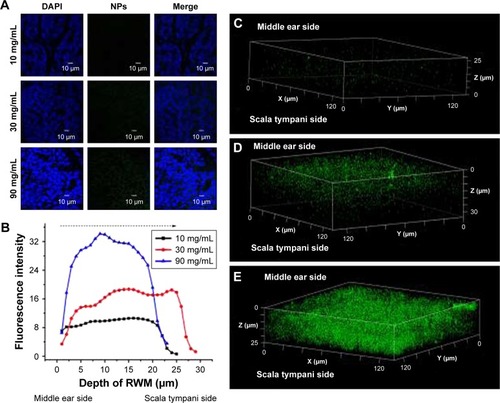
Figure 6 TEM images of RWM in the control group and intratympanic injection of PLGA NPs group. Subcellular characteristics of RWM in the control group (A, B) and intratympanic injection of PLGA NPs for 30-minute group (C–F). (A) Tight junctions which sealed the paracellular space between adjacent cells and a variety of organelles were found in the RWM outer epithelium layer. (B) There were four layers in the RWM inner epithelium layer, and each layer was marked by a rectangular frame; the large extracellular spaces were marked by double arrows. (C) Successive transport behavior, including endocytic pit, intracellular vesicles, and exocytic pit, was captured. Extensive endocytic and exocytic behaviors (D–F) and closed tight junction (D) in the RWM outer epithelium layer. Exocytotic release behavior was also observed in the RWM inner epithelium layer (F).
Abbreviations: TEM, transmission electron microscope; RWM, round window membrane; PLGA NPs, poly (lactic-co-glycolic acid) nanoparticles; M, mitochondria; N, nucleus; TJ, tight junction; G, Golgi apparatus; BM, basement membrane; CF, collagenous fiber.
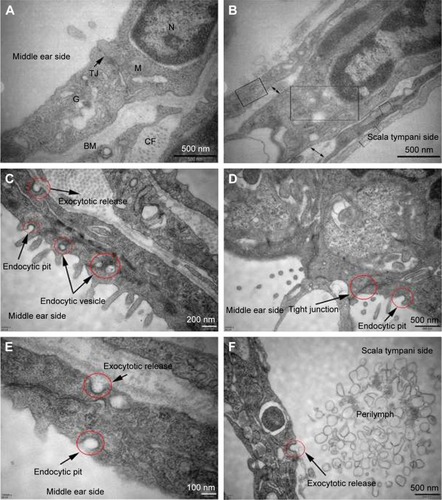
Figure 7 Safety evaluation of various inhibitors using paraffin sections of RWM. Control group (A), colchicine (B), MβCD (C), chlorpromazine hydrochloride (D), MON (E), and BFA (F).
Abbreviations: RWM, round window membrane; MβCD, methyl-β-cyclodextrin; MON, monensin sodium salt; BFA, brefeldin A.
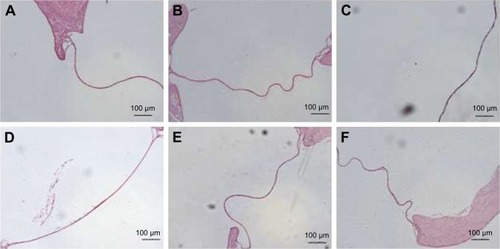
Figure 8 Endocytosis and exocytosis mechanisms of PLGA NPs across RWM. The effects of different endocytosis inhibitors (A) and exocytosis inhibitors (B) on the transport of PLGA NPs were monitored by HPLC. Incubation with only PBS represented the control and the related data were set as 100%. All data were compared to the control using ANOVA.
Abbreviations: PLGA NPs, poly (lactic-co-glycolic acid) nanoparticles; RWM, round window membrane; HPLC, high-performance liquid chromatography; PBS, phosphate-buffered saline; ANOVA, analysis of variance; MβCD, methyl-β-cyclodextrin; BFA, brefeldin A.
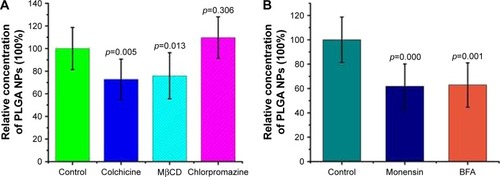
Figure 9 Colocalization analysis of PLGA NPs with lysosomes. CLSM micrographs of outer epithelium cells of RWM after intratympanic injection of PLGA NPs for 30 minutes (A). Colocalization scatterplots of PLGA NPs with lysosomes (B). Colocalization mask images showing only overlapping pixels (C). Quantitative colocalization parameters of PLGA NPs with lysosomes by measuring Manders’ overlap coefficient and Pearson’s correlation coefficient (D).
Abbreviations: PLGA NPs, poly (lactic-co-glycolic acid) nanoparticles; CLSM, confocal laser scanning microscope; RWM, round window membrane; DAPI, 4′,6-diamidino-2-phenylindole.
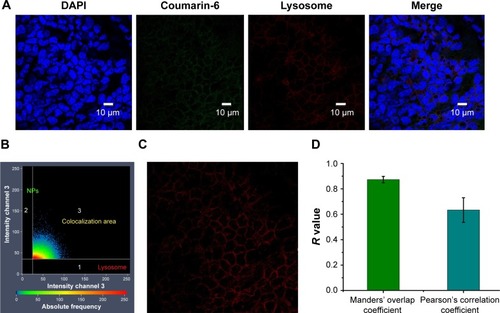
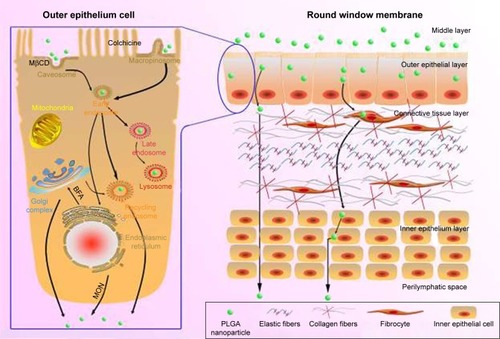
Figure 10 Schematic diagram of the transport pathways of NPs in the outer epithelium of the RWM (left) and the passage loci of PLGA NPs in the RWM (right). Black solid arrows indicate the pathways that were directly or indirectly proven in this study.
Abbreviations: PLGA NPs, poly (lactic-co-glycolic acid) nanoparticles; RWM, round window membrane; MβCD, methyl-β-cyclodextrin; MON, monensin sodium salt; BFA, brefeldin A.