Figures & data
Figure 1 Ballistic projectile, kinetic energy rod penetration of a target plate. A) Rod of length, l0, impacting a plate at a velocity of uo. B) Penetrating rod, eroding at its head to form a rod erosion tube (RET) around the projectile head at reduced velocity uo′. C) Perforated plate which has formed a target erosion tube (TET) similar to the rod erosion tube in B. Ballistic debris field in the front and rear of the impacted target (D). D) Polished cross-section of a 3.5 cm Cu target plate penetrated by a heavy alloy tungsten rod. E) Flash X-ray radiograph showing heavy alloy tungsten rod penetrating the Cu target in (D). The eroded projectile head exiting the target is shown at P. The debris field behind target plate is shown at D.
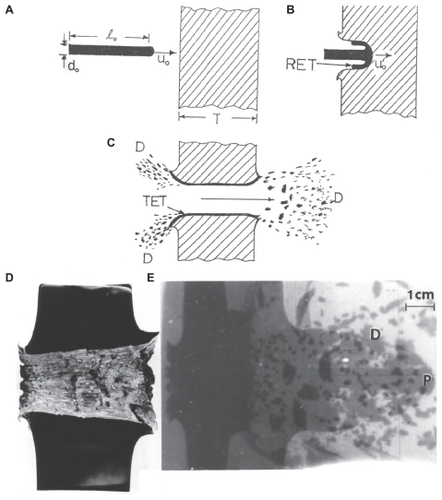
Figure 2 Section view of polished and etched W (kinetic energy) rod penetrating a steel target plate at an impact velocity (uo in ) of 1.3 km/sec. Note target erosion tube (TET) and rod erosion tube (RET) zones which flow in the direction opposite to the penetration direction. Debri fragments are denoted as D. Also note recrystallization of the head of the single-crystal W rod, and erosive flow at the head.
Abbreviations: SB, shear bands; RHA, rolled homogeneous armor; S, erosion tube initiation zones.
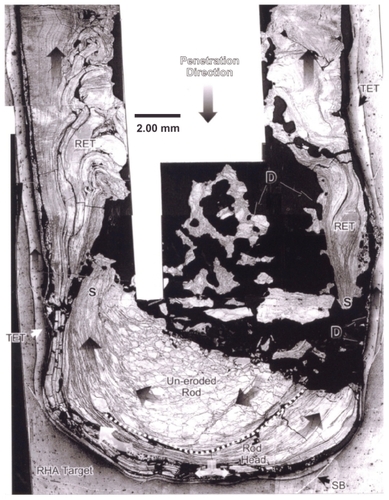
Figure 3 Field-emission scanning electron microscope view of collected ballistic (impact) debris (A), and the corresponding energy-dispersive spectrum (B): W–Ni–Fe.
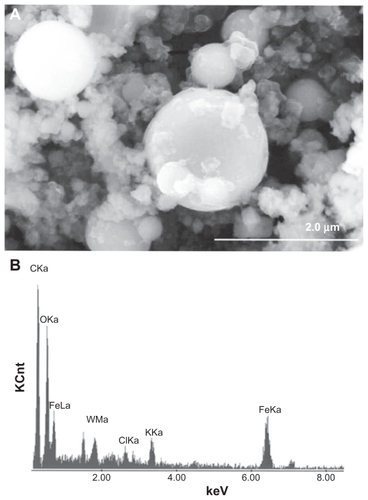
Figure 4 Transmission electron microscopy image of collected impact debris as in , and corresponding energy-dispersive spectrometry spectrum B: W–Ni–Fe. Note the sandwich is composed of coated Cu grids. The Cu peak (Kα) arises from the grid. Note small Ni peak.
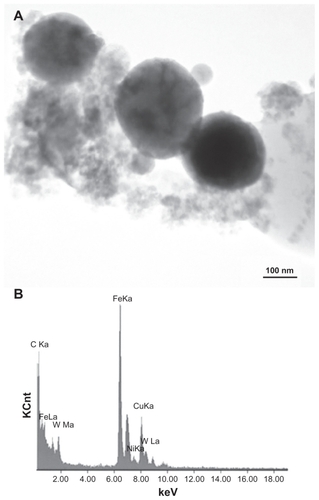
Figure 5 Transmission electron microscopy x-ray (energy-dispersive spectrometry) mapping sequence for W–Ni–Fe ballistic debris sample. A) Bright-filled image of aggregated particulates. B) W map, C) Ni map, and D) Fe map.
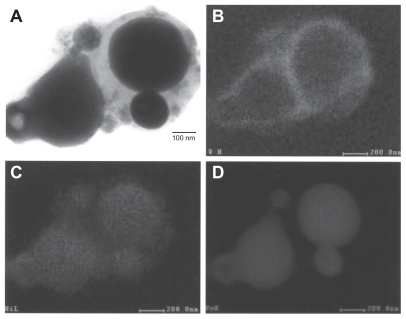
Figure 6 Transmission electron microscopy x-ray (energy-dispersive spectrometry) mapping sequence for W–Ni–Co ballistic debris sample. A) Bright-field image of aggregated particulates, B) energy-dispersive spectrometry spectrum of (A), C) Ni map, D) W map, E) Fe map, and F) Co map.
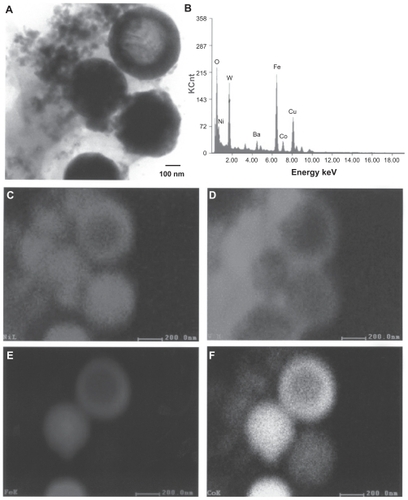
Figure 7 Field-emission scanning electron microscope images of micron-sized Fe and W powders. A Fe, B Fe, and C W.
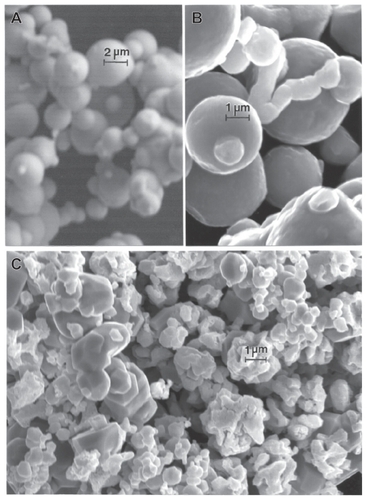
Figure 8 Magnified field-emission scanning electron microscope images for micronsize Fe and W powders. A Fe and B W.
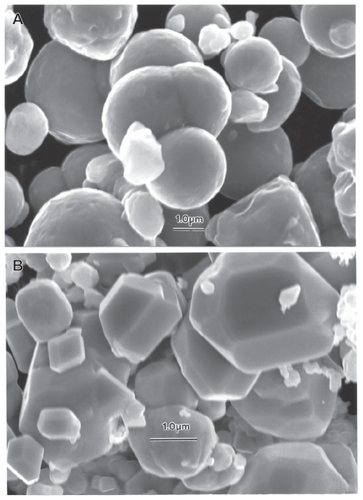
Figure 9 Transmission electron microscopy image for nano-Fe powder with field-emission scanning electron microscope image insert showing nanoparticulate aggregation.
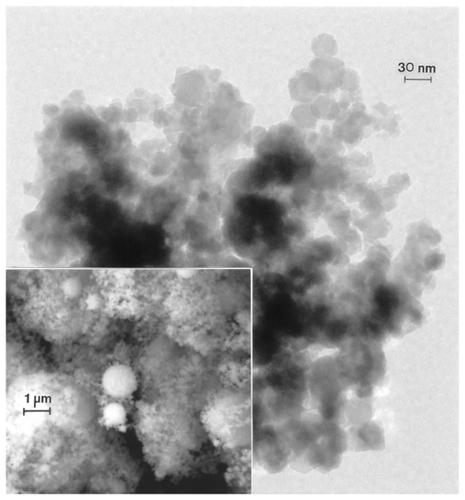
Figure 10 Transmission electron microscopy image for nano-W powder with field-emission scanning electron microscope image insert showing nanoparticulate aggregation.
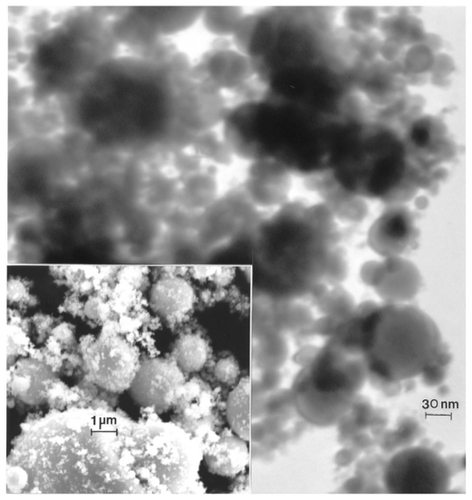
Figure 11 Field-emission scanning electron microscope images for micron-sized Ni A and Co B powders.
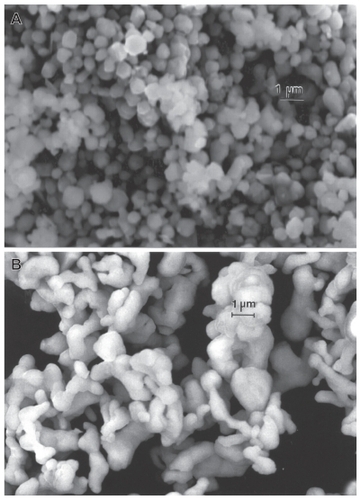
Figure 12 Transmission electron microscopy image for nano-Ni powder with fieldemission scanning electron microscope insert showing nanoparticulate aggregation. The features noted by arrows are microstructural twins in the particles.
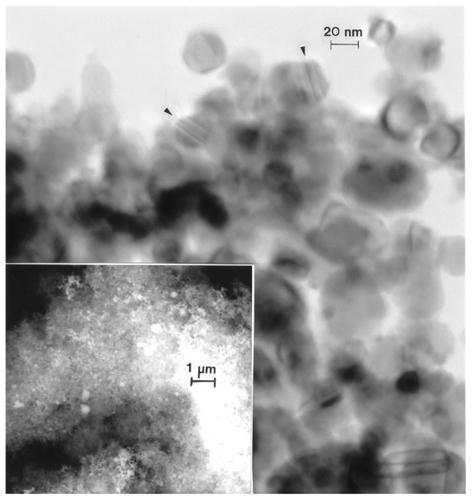
Figure 13 Transmission electron microscopy bright-field A) and dark-field B) sequence for nano-Ni powder utilizing selected diffraction spots from the selected-area electron diffraction pattern insert (circle). Arrows in B show diffracting nanoparticles.
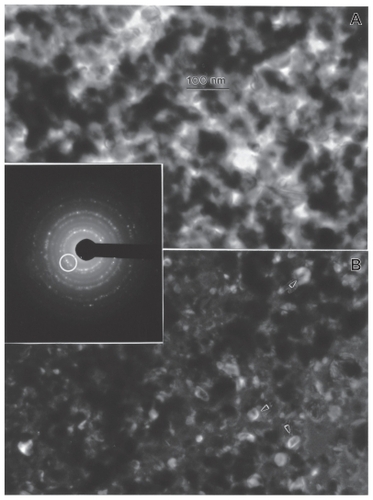
Figure 14 Transmission electron microscopy image for nano-Co powder with fieldemission scanning electron microscope insert showing nanoparticulate aggregation.
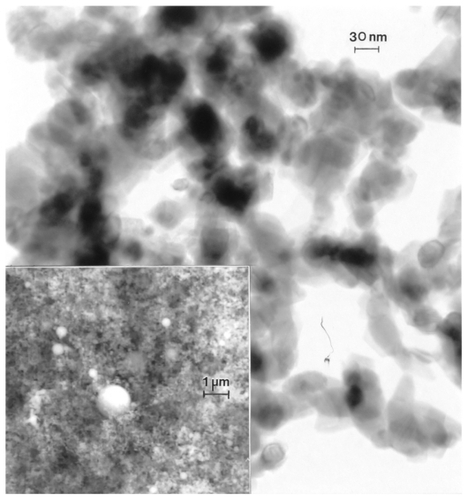
Figure 15 High-resolution transmission electron microscopy image for nano- Co powder aggregates showing Moire fringe pattern with 1.3 nm fringe spacing (arrow).

Table 1 Experimental (manufactured) powder properties
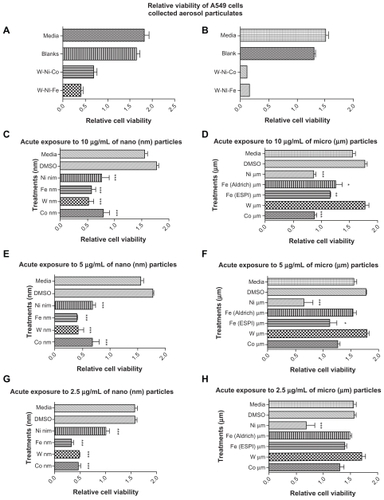
Figure 16 Comparative cytotoxicities (as relative A549 epithelial cell viability). A) and B) show collections for four separate ballistic events, ie, two for W–Ni–Fe and two for W–Ni–Co KE rods penetrating Fe target plates. C) and D) compare nanosized and micron-sized powders at concentrations in culture of 10 μg/mL. E) and F) compare nanosized and micron-sized powders at concentrations in culture of 5 μg/mL. G) and H) compare nanosized and micron-sized powders at concentrations of 2.5 μg/mL. All cell culture assays A) to H) are compared with culture media as a control. A) and B) also show blank filter culture as a control. C) to H) show dimethyl sulfoxide as a control.
Notes: *P < 0.5; **P < 0.0015; ***P < 0.0001.
Abbreviations: DMSO, Dimethyl Sulfoxide; ESPI, high purity metals manufacturing company.