Figures & data
Figure 1 Preparation and characterizaion of iLPs. (A) Systemic illustration of preparation of iLPs. (B) Morphology of iLPs by TEM. (C) Size distrubition of iLPs. (D) Fluorescence image of iLPs and free ICG after light exposure. (E) Quantitative analysis of fluorescence intensity of iLPs and free ICG after light exposure, the stability of iLP was found to be superior to that of free ICG (**P<0.01).
Abbreviations: iLPs, ICG-liposomes decorated with iRGD; TEM, transmission electron microscopy; ICG, indocyanine green; DPPC, dipalmitoylphosphatidylcholine; DSPE-PEG2000, 1,2-distearoyl-sn-glycero-3-pho-sphoethanolamine-N-[met-hoxy(poly-ethyleneglycol)-2000]; iRGD, targeting peptide (CRGDKGPDC).
![Figure 1 Preparation and characterizaion of iLPs. (A) Systemic illustration of preparation of iLPs. (B) Morphology of iLPs by TEM. (C) Size distrubition of iLPs. (D) Fluorescence image of iLPs and free ICG after light exposure. (E) Quantitative analysis of fluorescence intensity of iLPs and free ICG after light exposure, the stability of iLP was found to be superior to that of free ICG (**P<0.01).Abbreviations: iLPs, ICG-liposomes decorated with iRGD; TEM, transmission electron microscopy; ICG, indocyanine green; DPPC, dipalmitoylphosphatidylcholine; DSPE-PEG2000, 1,2-distearoyl-sn-glycero-3-pho-sphoethanolamine-N-[met-hoxy(poly-ethyleneglycol)-2000]; iRGD, targeting peptide (CRGDKGPDC).](/cms/asset/a565439f-148f-4336-9331-dfa99e3fd177/dijn_a_155475_f0001_c.jpg)
Figure 2 Targeted cellular uptake of iLPs. Confocal fluorescence images displayed cellular uptake of ICG after incubation with free ICG, LPs, iRGD+iLPs, or iLPs. Blue represents the localization of cell nucleus with the fluorescence of DAPI and red represents the localization of ICG (scale bar, 50 μm).
Abbreviations: iLPs, ICG-liposomes decorated with iRGD; LPs, ICG-liposomes; ICG, indocyanine green; iRGD, targeting peptide (CRGDKGPDC).
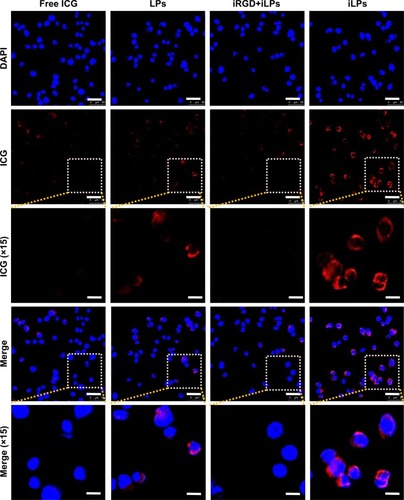
Figure 3 RA model and radiological evalution. (A) RA models were successfully induced by injection with collagen and Freund’s adjuvant. (B, C, and D) Radiological evaluation showed there was no joint destruction and interarticular stenosis in inflamed paw in mice pretreated with iLPs, LPs, and free ICG. The yellow arrow indicates the normal paw, and the red arrow indicate the inflamed paw.
Abbreviations: iLPs, ICG-liposomes decorated with iRGD; LPs, ICG-liposomes; ICG, indocyanine green; RA, rheumatoid arthritis; iRGD, targeting peptide (CRGDKGPDC).
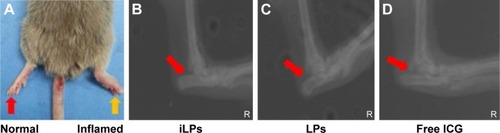
Figure 4 NIR fluorescence imaging in RA models. (A) NIR imaging of RA models with two symptomatic paws was performed at predetermined times after injection with iLPs and LPs, and stronger fluorescence signal in was detected in iLPs group than in LPs group, achieving high sensitivity for NIR fluorescence imaging by iLPs. (B) The semi-quantitative analysis of NIR fluorescence imaging in RA models with two symptomatic paws displayed that the fluorescence signal was always higher in iLPs group than in LPs group within 24 h (**P<0.01). (C) NIR imaging of RA models with one inflamed paw was performed at predetermined time intervals (15 min, 2 h) after injection with iLPs, LPs, or free ICG, and strong fluorescence signal was detected in inflamed joint (red arrow) and almost no signal was detected in normal joint (black arrow) in iLPs group, achieving high specificity for NIR fluorescence imaging by iLPs.
Abbreviations: iLPs, ICG-liposomes decorated with iRGD; LPs, ICG-liposomes; ICG, indocyanine green; iRGD, targeting peptide (CRGDKGPDC); RA, rheumatoid arthritis; NIR, near-infrared.
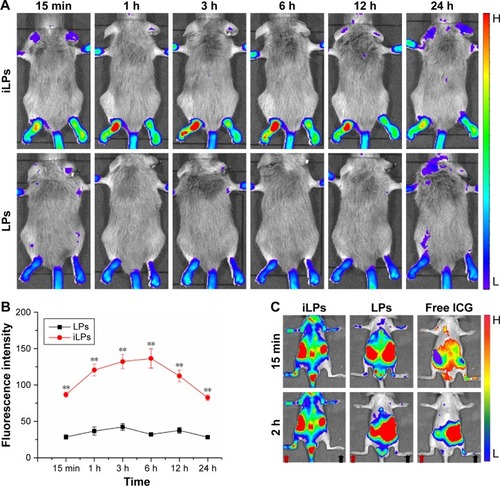
Figure 5 The biodistribution and safety analysis in main organs. (A) Biodistribution of iLPs and LPs in the main organs at 24 h after injection. (B) The semi-quantitative analysis for biodistribution of iLPs and LPs; there was no significant difference in the same organs (P>0.05), but the fluorescence signals in spleen was a little higher than in liver (**P<0.01), which is different from the previous studies which were conducted in tumor models. (C) H…E stained images of major organ slices collected from normal DAB/1J mice and RA models treated with iLPs; no significant difference was observed, showing that iLPs had a favorable safety profile.
Abbreviations: H…E, hematoxylin-eosin; iLPs, ICG-liposomes decorated with iRGD; LPs, ICG-liposomes; ICG, indocyanine green; iRGD, targeting peptide (CRGDKGPDC); RA, rheumatoid arthritis.
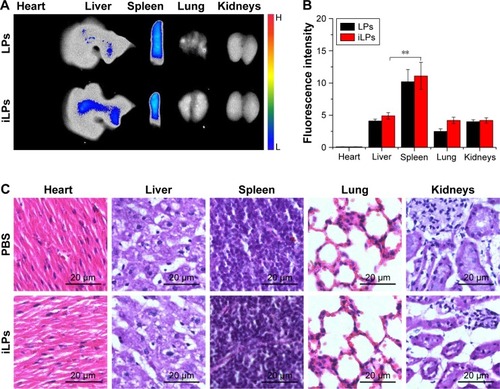
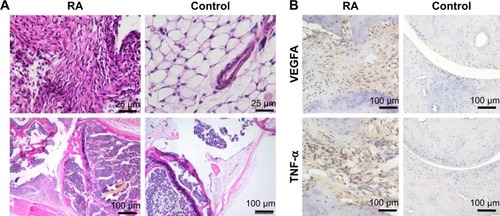
Figure 6 Histological analysis. (A) H…E staining shows hyperplastic synovium in inflamed joint and non-hyperplastic synovium in normal joint, which matched the results of NIR fluorescence imaging, further confirming the high specificity of imaging modes. (B) The immunohistochemical staining indicated the overexpression of VEGFA and TNF-α in inflamed joint, which showed that imaging by using iLPs as probes can reflect the severity of RA, to some extent.
Abbreviations: RA, rheumatoid arthritis; NIR, near-infrared.