Figures & data
Figure 1 Schematic representation of oxSWNHs containing the TBP–NHBP peptide complex (oxSWNHs/TBP–NHBP) on the Ti surface. oxSWNHs were modified by artificial peptide aptamers against SWNH (NHBP-1) and Ti (minTBP-1).
Abbreviations: oxSWNHs, oxidized single-walled carbon nanohorns; TBP, Ti-binding peptide; NHBP-1, SWNH-binding peptide.
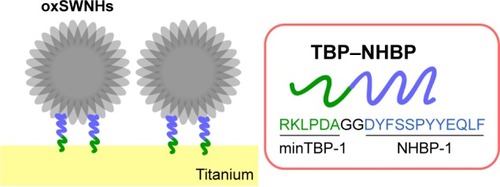
Figure 2 Scanning electron micrographs of Ti plates functionalized with oxSWNHs/TBP–NHBP. (A–E) Ti plates were functionalized with oxSWNHs/TBP–NHBP (A), oxSWNHs (B), oxSWNHs/TBP(R-A)-NHBP (C), oxSWNHs/TBP (D), or oxSWNHs/NHBP (E). The inset shows magnified sections. Black scale: 20 µm; red scale: 2 µm. (F) Adsorption amounts measured using an electronic balance.
Abbreviations: oxSWNHs, oxidized single-walled carbon nanohorns; TBP, Ti-binding peptide; NHBP-1, SWNH-binding peptide.
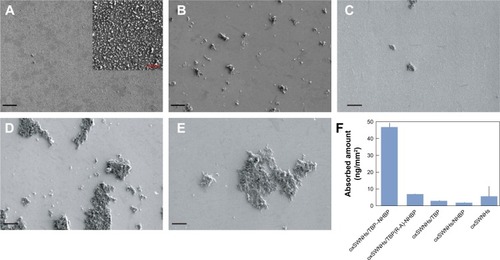
Figure 3 Time-dependent changes in f and D determined using a QCM. (A–F) oxSWNHs/TBP–NHBP (A), oxSWNHs (B), TBP–NHBP (C), oxSWNHs/TBP–NHBP (D), TBP–NHBP (E), and TBP–NHBP and oxSWNHs/TBP–NHBP (F) deposited on a Ti-coated sensor. Values on the longitudinal axis represent negative Δf and positive ΔD values. Changes associated with oxSWNHs/TBP–NHBP, oxSWNHs, and TBP–NHBP adsorption are indicated by green, gray, and purple lines, respectively. Green, gray, and purple arrowheads indicate the time points at which oxSWNHs/TBP–NHBP, oxSWNHs, and TBP–NHBP, respectively, were infused into the measurement chamber. Vs represent the time points at which the wash solution (10% DMF) was infused.
Abbreviations: oxSWNHs, oxidized single-walled carbon nanohorns; TBP, Ti-binding peptide; NHBP-1, SWNH-binding peptide; DMF, dimethylformamide.
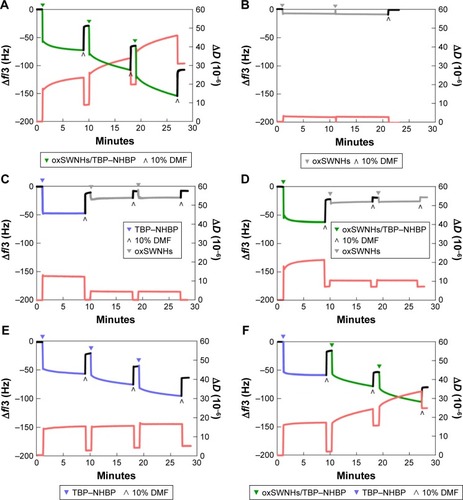
Figure 4 Viability of MC3T3-E1 cells cultured for 2 days on oxSWNHs/TBP–NHBP on Ti. Viable cell counts were determined relative to cells grown on uncoated Ti (none). (A) Live (green, left panel) and dead (red, right panel) cells were stained with calcein-AM and propidium iodide, respectively. White scale: 100 µm. (B) Counts of live cells on uncoated Ti and oxSWNHs/TBP–NHBP-conjugated Ti. Error bars indicate standard deviation (n=4).
Abbreviations: oxSWNHs, oxidized single-walled carbon nanohorns; TBP, Ti-binding peptide; NHBP-1, SWNH-binding peptide.
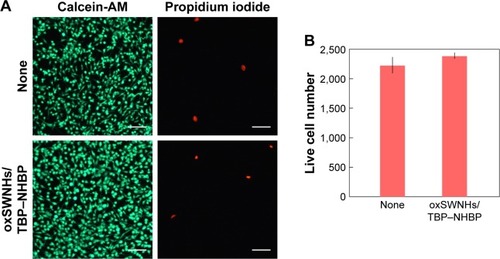
Figure 5 In vitro release of DEX from DEX-oxSWNHs/TBP–NHBP on Ti. Time course of cumulative release of [3H]-DEX from DEX-oxSWNHs/TBP–NHBP on Ti plates in PBS (blue line), RPMI medium/5% FBS (green line), and α-MEM/5% FBS (red line) at 37°C over 14 days. The inset shows cumulative release of DEX from DEX-oxSWNHs/TBP–NHBP on Ti plates in PBS (blue line), RPMI medium/5% FBS (green line), and α-MEM/5% FBS (red line) at 37°C for 24 hours. Error bars indicate standard deviation (n=3).
Abbreviations: DEX, dexamethasone; PBS, phosphate-buffered saline; RPMI, Roswell Park Memorial Institute; α-MEM, α-minimal essential medium; oxSWNHs, oxidized single-walled carbon nanohorns; TBP, Ti-binding peptide; NHBP-1, SWNH-binding peptide.
![Figure 5 In vitro release of DEX from DEX-oxSWNHs/TBP–NHBP on Ti. Time course of cumulative release of [3H]-DEX from DEX-oxSWNHs/TBP–NHBP on Ti plates in PBS (blue line), RPMI medium/5% FBS (green line), and α-MEM/5% FBS (red line) at 37°C over 14 days. The inset shows cumulative release of DEX from DEX-oxSWNHs/TBP–NHBP on Ti plates in PBS (blue line), RPMI medium/5% FBS (green line), and α-MEM/5% FBS (red line) at 37°C for 24 hours. Error bars indicate standard deviation (n=3).Abbreviations: DEX, dexamethasone; PBS, phosphate-buffered saline; RPMI, Roswell Park Memorial Institute; α-MEM, α-minimal essential medium; oxSWNHs, oxidized single-walled carbon nanohorns; TBP, Ti-binding peptide; NHBP-1, SWNH-binding peptide.](/cms/asset/0f5658c7-f9d9-44f7-adf9-3d9bce5e073d/dijn_a_12193961_f0005_c.jpg)
Figure 6 Effects of DEX-oxSWNHs on GR transcriptional activity. ST2 cells were transfected with pBV2-MMTV-LUC and incubated with oxSWNHs/TBP–NHBP, DEX, or DEX-oxSWNHs/TBP–NHBP on Ti plates. Error bars indicate standard deviation (n=5). **P<0.01.
Abbreviations: oxSWNHs, oxidized single-walled carbon nanohorns; TBP, Ti-binding peptide; NHBP-1, SWNH-binding peptide; DEX, dexamethasone.
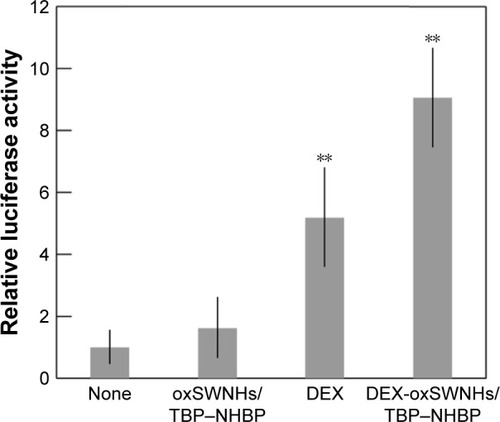
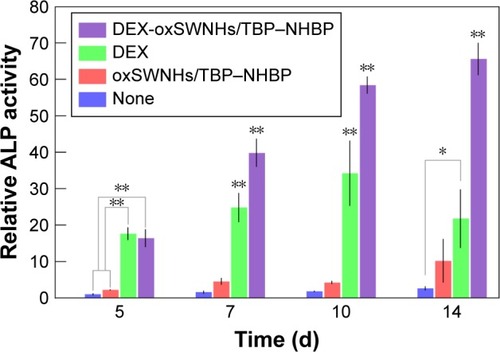
Figure 7 Effects of DEX-oxSWNHs on ALP activity. MC3TS-E1 cells were cultured with oxSWNHs/TBP–NHBP, DEX, or DEX-oxSWNHs/TBP–NHBP on Ti plates for 5, 7, 10, and 14 days. Error bars indicate standard deviation (n=5). **P<0.01; *P<0.05.
Abbreviations: ALP, alkaline phosphatase; DEX, dexamethasone; oxSWNHs, oxidized single-walled carbon nanohorns; TBP, Ti-binding peptide; NHBP-1, SWNH-binding peptide.