Figures & data
Table 1 Properties of CMCS-OH30 NP and CMCS NP (mean ± SD, n = 6)
Figure 1 TEM images of CMCS-OH30 NP releasing in SWF solution (pH 7.4). (A) Initial shape in SWF, (B) 4 h in SWF, (C) 12 h in SWF, and (D) 24 h in SWF.
Abbreviations: CMCS-OH30 NP, carboxymethyl chitosan nanoparticles; SWF, simulated wound fluid.
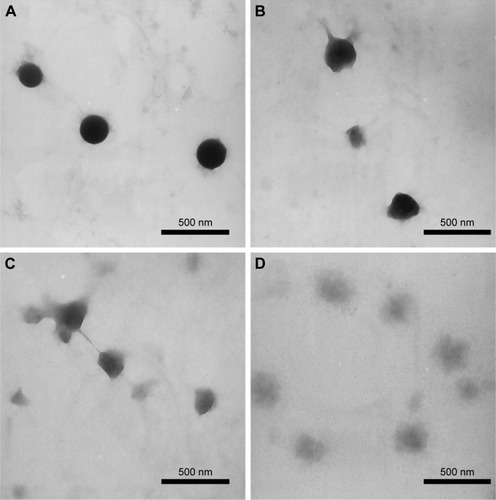
Figure 2 In vitro drug release curve and antimicrobial activity assay.
Notes: (A) In vitro release profile of OH30 (plotted as a function of % cumulative release vs time) from CMCS-OH30 NP (mean ± SD, n = 3). (B) Representative antibacterial activities of CMCS-OH30 NP and CMCS NP against the E. coli (mean ± SD, n = 3). Three independent experiments were carried out and each tested points was triplicated in all experiments.
Abbreviations: CMCS-OH30 NP, carboxymethyl chitosan nanoparticles; E. coli, Escherichia coli.
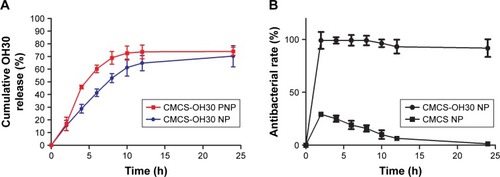
Figure 3 Internalization of OH30 in RAW264.7 cells were detected by confocal laser scanning microscope.
Notes: Cells were treated with CMCS-OH30 NP at 37°C for 1 h (A) and 4 h (B). Cells were treated with free OH30 at 37°C for 1 h (C) and 4 h (D). Nuclei were stained with Hoechst 33258 (blue) and OH30 labeled by Cy5 (red).
Abbreviation: CMCS-OH30 NP, carboxymethyl chitosan nanoparticles.
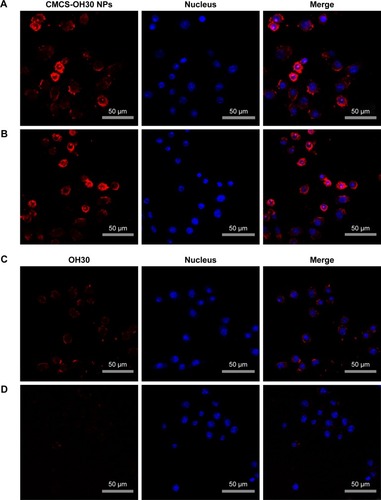
Figure 4 In vitro HaCaT cell migration assays.
Notes: (A) Effects of untreated, CMCS NP, OH30, and CMCS-OH30 NP were assessed by microscope images. (B) Cell migration rates of each group were expressed as percentage of initial blank area. Statistical significance compared with other groups (mean ± SD; n = 4; *p < 0.05 and **p < 0.01).
Abbreviation: CMCS-OH30 NP, carboxymethyl chitosan nanoparticles.
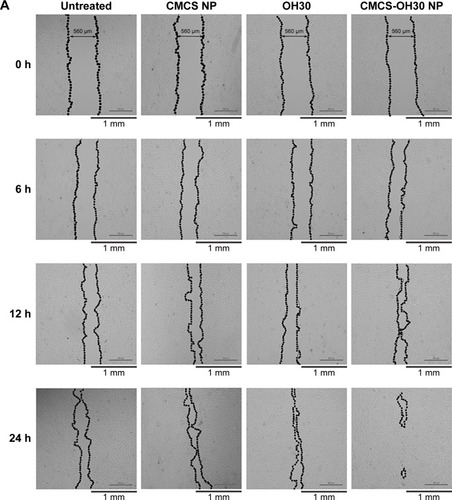
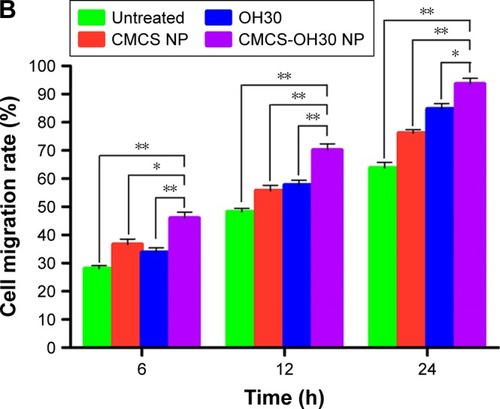
Figure 5 Distribution of CMCS-OH30 NP in the nude mouse skin tissue observed by fluorescence microscope.
Notes: Images of CMCS-OH30 NP at 1 h (A) and 4 h (B) posttreatment; images of free OH30 at 1 h (C) and 4 h (D) posttreatment. OH30 used was labeled with Cy5 (red).
Abbreviation: CMCS-OH30 NP, carboxymethyl chitosan nanoparticles.
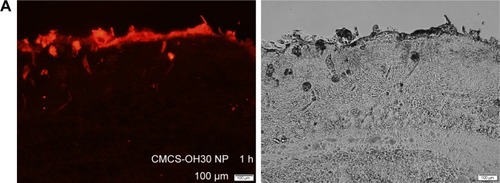
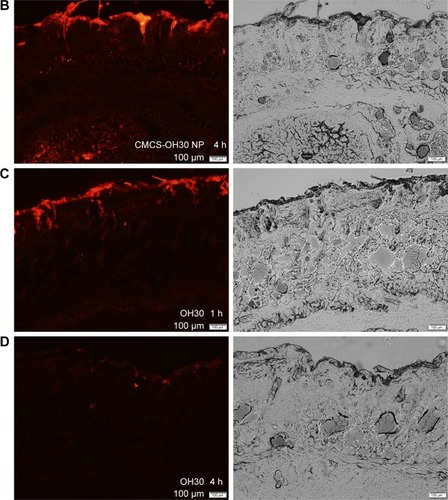
Figure 6 Wound healing effects on mice models.
Notes: (A) Macroscopic observations of wound closure for different treated groups at day 0, 5, 10, and 15 postinjury. The initial wounds were round (ID = 7 mm). (B) Wound closure rate of all groups. Data were presented as mean ± SD, n = 6. *p < 0.05 and **p < 0.01, contrast with other groups.
Abbreviation: CMCS-OH30 NP, carboxymethyl chitosan nanoparticles.
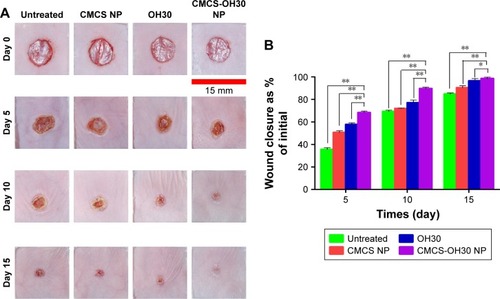
Figure 7 Histological examination of the healing wounds skin sections at day 15 postinjury in four tested groups.
Notes: MT staining (A) and H&E staining (B). The green arrow indicated the multiple invaginated epidermises. Scale bars = 200 μm.
Abbreviations: CMCS-OH30 NP, carboxymethyl chitosan nanoparticles; MT, Masson’s trichrome; H&E, hematoxylin and eosin.
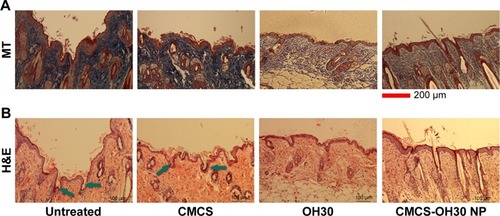
Figure 8 Quantification of collagen I and III content in skin homogenate 15 days after injury.
Notes: The content of collagen I (A), the content of collagen III (B), the ratio of collagen I and collagen III (C), and the total content of collagen I plus collagen III (D). Statistical significance of CMCS-OH30 NP group was compared with other groups (mean ± SD; n = 6, Student’s t-test. *p < 0.05 and **p < 0.01).
Abbreviation: CMCS-OH30 NP, carboxymethyl chitosan nanoparticles.
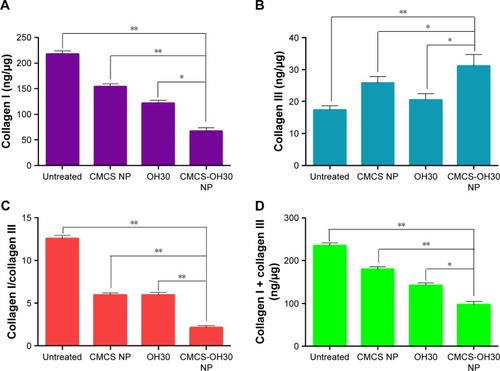
Figure 9 Quantification of cytokines in skin lysates.
Notes: IL-6 (A), IL-8 (B), IL-10 (C), TGF-β1 (D), and TNF-α1 (E). The black boxes ■ on the y-axis refer to the quantification level of cytokines in normal mouse skin. Statistical significance compared with the untreated group was indicated (mean ± SD; n = 6, Student’s t-test. *p < 0.05 and **p < 0.01).
Abbreviations: CMCS-OH30 NP, carboxymethyl chitosan nanoparticles; d, days.
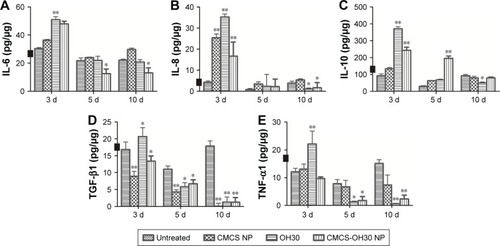
Figure S1 Atomic force microscopic images of CMCS-OH30 NP after the storage of 7 days at 4°C.
Abbreviation: CMCS-OH30 NP, carboxymethyl chitosan nanoparticles.
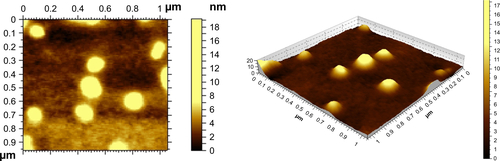
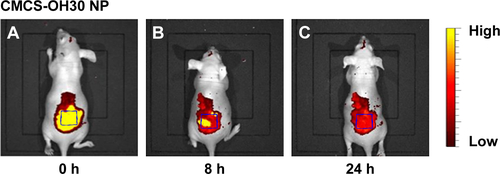
Figure S2 In vivo evaluation of controlled-releasing effects of prepared CMCS-OH30 NP.
Notes: Nanoparticles were prepared using FITC-labeled OH30. NIR optical imaging of nude mice at (A) 0 h, (B) 8 h, and (C) 24 h posttreatment.
Abbreviations: CMCS-OH30 NP, carboxymethyl chitosan nanoparticles; NIR, near-infrared.