Figures & data
Table 1 Composition of Act-loaded niosomal formulations
Table 2 Characterization of Act-loaded niosomal formulations
Figure 1 TEM image, size, and zeta potential distribution curves of Act-loaded niosome (F1).
Note: (A) TEM image, (B) size distribution curve, and (C) zeta potential distribution curve.
Abbreviations: Act, Acitretin; TEM, transmission electron microscope.
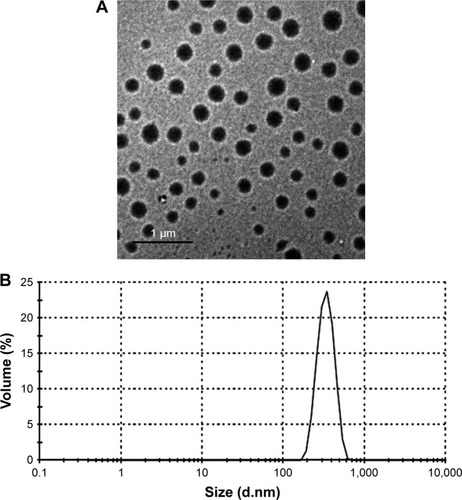
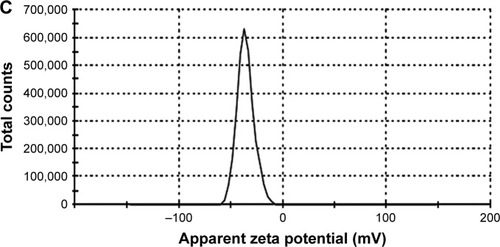
Figure 2 DSC thermograms.
Note: (A) Act, (B) Span 60, (C) CH, (D) physical mixture, (E) plain niosome, and (F) Act-loaded niosome (F1).
Abbreviations: Act, Acitretin; CH, cholesterol; DSC, differential scanning calorimetry.
Figure 3 PXRD patterns.
Note: (A) Act, (B) Span 60, (C) CH, (D) physical mixture, (E) plain niosome, and (F) Act-loaded niosome (F1).
Abbreviations: Act, Acitretin; CH, cholesterol; PXRD, powder X-ray diffractometry.
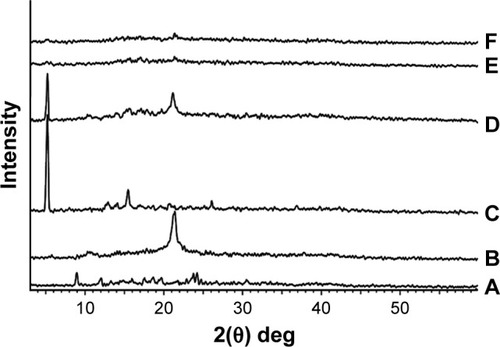
Figure 4 Ex vivo skin permeation profiles of Act from different niosomal formulations.
Note: Each point represents the mean ± SD (n=3).
Abbreviation: Act, Acitretin.
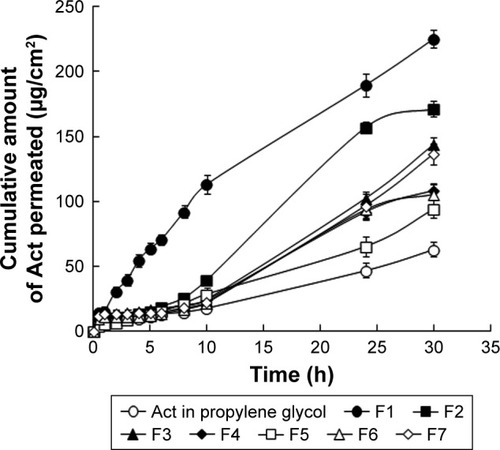
Table 3 Ex vivo skin permeation parameters of Act from different niosomal formulations across the excised rat skin after 30 h
Table 4 Stability study data of Act-loaded niosomal formulation (F1) after storage at refrigerated and room temperatures
Table 5 Evaluation parameters of different gel formulations
Table 6 Ex vivo skin permeation parameters of Act from different gel formulations across the excised rat skin after 30 h
Figure 5 Ex vivo skin permeation profiles of Act from different gel formulations.
Note: Each point represents the mean ± SD (n=3).
Abbreviation: Act, Acitretin.
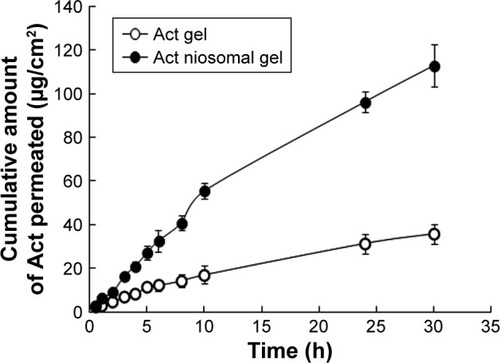
Figure 6 Ex vivo skin deposition profiles of Act from different gel formulations.
Notes: Each value represents the mean ± SD (n=3). *p<0.05 vs Act gel using Student’s t-test (unpaired t-test).
Abbreviations: Act, Acitretin; SC, stratum corneum; VED, viable epidermis/dermis.
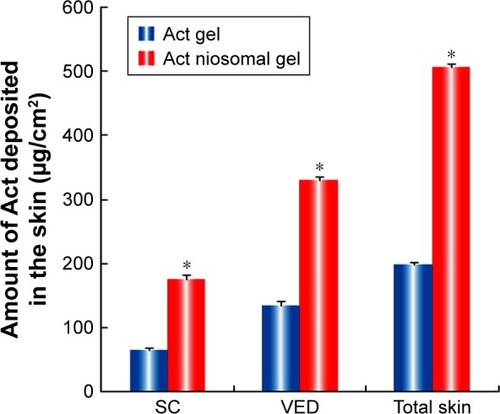
Table 7 Kinetic analysis of the release data of Act from niosomal dispersion and different gel formulations
Figure 7 Ex vivo cytotoxicity studies performed by MTT assay.
Notes: (A) L929 cell line. (B) HaCaT cell line. Each value represents the mean ± SD (n=3). *p<0.05 vs plain niosome corresponding to the same concentration, **p<0.05 vs Act corresponding to the same concentration.
Abbreviations: Act, Acitretin; HaCaT, human epidermal keratinocytic cells; L929, mouse dermal fibroblast cells.
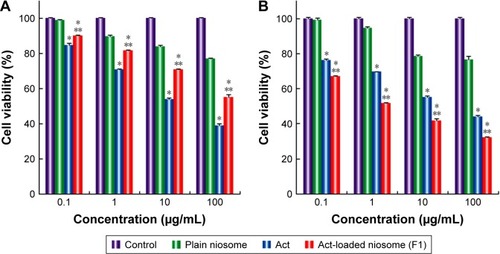
Figure 8 Monitoring progression of irritation before and after (7 days) topical application of different gel formulations.
Abbreviation: Act, Acitretin.
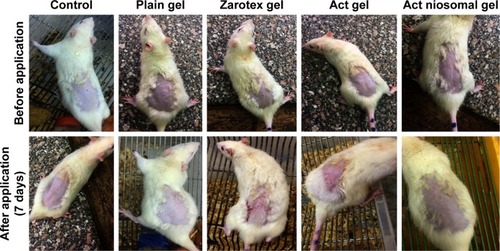
Figure 9 Primary irritation index after topical application of different gel formulations for 7 days (n=6).
Abbreviation: Act, Acitretin.
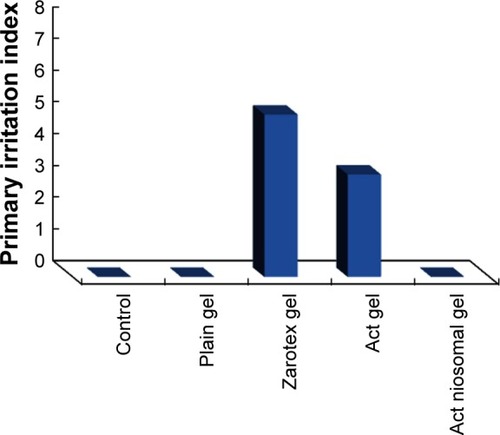
Figure 10 Photomicrographs of histopathologic examination of skin irritation after topical application of different gel formulations for 7 days.
Notes: (A) Control rat skin, (B) plain gel, (C) zarotex gel, (D) Act gel, and (E) Act niosomal gel. H&E (100×). Photomicrograph of skin treated with zarotex gel showed necrosis of the epidermis with crust formation of the overlying superficial layer (arrow) and dilated blood capillaries in the underlying dermis (arrowhead). Photomicrograph of skin treated with Act gel exhibited degenerative changes of the prickle cell layer and status spongiosus formation (arrow) with normal dermis and skin appendages.
Abbreviation: Act, Acitretin.
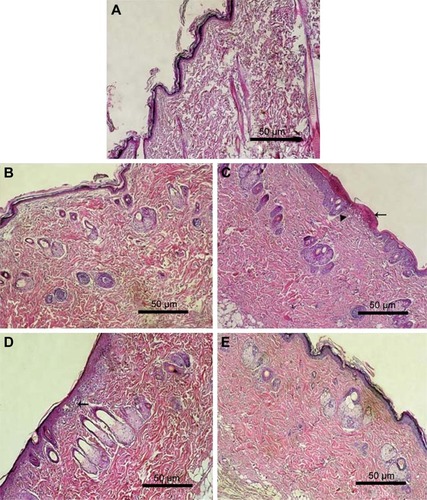
Table 8 Effect of different gel formulations on the degree of orthokeratosis, drug activity, and reduction in epidermal thickness in mouse tail model after topical application for 4 weeks
Figure 11 Photomicrographs of histopathologic examination of mouse tail skin after topical application of different gel formulations for 4 weeks.
Notes: (A) Control tail skin, (B) plain gel, (C) zarotex gel, (D) Act gel, and (E) Act niosomal gel. H&E (100×).
Abbreviations: Act, Acitretin; C, blood capillaries; D, dermis; EP, epidermis; M, Munro abscess; R, rete ridges; SC, stratum corneum.
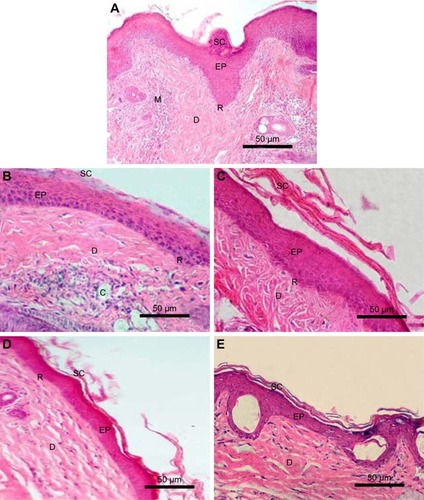
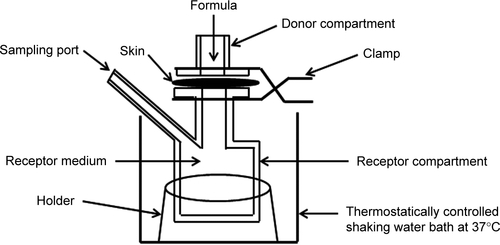
Figure S1 Schematic diagram of the skin permeation measurement apparatus.