Figures & data
Figure 1 Preparation of GP-PGA-Fe3O4-CDs@BPQDs nanoplatform.
Notes: (A) Fabrication of the GP-PGA-Fe3O4-CD@BPQD nanoplatform; (B) TEM (a) and HRTEM (b) of BPQDs; (C) TEM (a) and HRTEM (b) of Fe3O4-CDs; (D) TEM of PGA-Fe3O4-CDs; (E) elemental mapping images of PGA-Fe3O4-CDs; (F) TEM of GP-PGA-Fe3O4-CDs@BPQDs; (G) lateral sizes of 50 GP-PGA-Fe3O4-CDs@BPQDs determined using TEM; (H) TEM showing the morphology of GP-PGA-Fe3O4-CD@BPQD assemblies and corresponding cross-linking degree of GP at different cross-linking times; (I) elemental mapping images of GP-PGA-Fe3O4-CDs@BPQDs assemblies after 3 hours of cross-linking.
Abbreviations: GP, genipin; PGA, polyglutamic acid; CD, carbon dot; BPQD, black phosphorus quantum dot; HRTEM, high-resolution transmission electron microscopy; NMP, N-methyl-2-pyrrolidone.
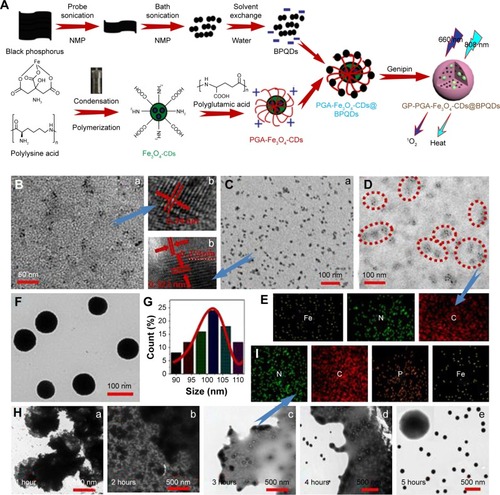
Figure 2 Characterization of GP-PGA-Fe3O4-CDs@BPQDs nanoplatform.
Notes: (A) XPS spectrum of the P 2p peaks from the BPQDs; (B) ζ-potential of as-prepared samples from different steps; (C) survey XPS spectrum of GP-PGA-Fe3O4-CDs@BPQDs; (D) Raman scattering spectra of BPQDs and GP-PGA-Fe3O4-CDs@BPQDs.
Abbreviations: XPS, X-ray photoelectron spectroscopy; BPQDs, black phosphorus quantum dots; GP, genipin; PGA, polyglutamic acid; CDs, carbon dots.
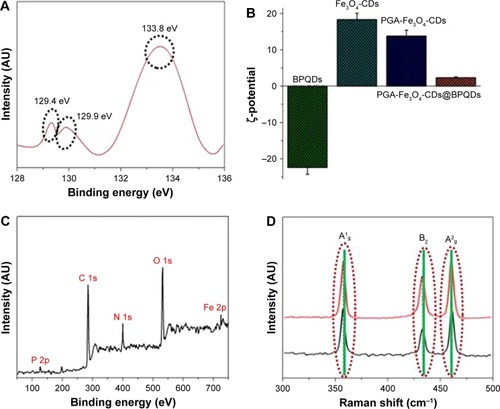
Figure 3 Photochemical and photodynamic properties of GP-PGA-Fe3O4-CDs@BPQDs nanoplatform.
Notes: (A) Ultraviolet-visible NIR-absorption spectra of GP-PGA-Fe3O4-CD@BPQD nanoparticle solutions at different concentrations. The arrow represents the increasing concentration of the sample. (B) Temperature elevation of GP-PGA-Fe3O4-CD@BPQD nanoparticles (50 μg/mL) under irradiation with a 660 nm (0.5 W/cm2) or 808 nm (2 W/cm2) laser as a function of irradiation time. Inset, temperature IR images of an aqueous solution of GP-PGA-Fe3O4-CDs@BPQDs under 660 nm (0.5 W/cm2) or 808 nm (2 W/cm2) laser irradiation, which was recorded using an IR camera. (C) ESR spectra of GP-PGA-Fe3O4-CDs@BPQDs in the presence of TEMP in different conditions. Both the decomposition of DPBF and ESR spectra were carried out under an Xe lamp with a 600 nm cutoff filter. (D) Decay curves of Na2-ADPA absorption at 378 nm as a function of time in the presence of GP-PGA-Fe3O4-CDs@BPQDs and MB <660 nm laser irradiation (0.5 W/cm2). The arrows in part C represent the curve of the sample.
Abbreviations: NIR, near-infrared; GP, genipin; PGA, polyglutamic acid; CD, carbon dot; BPQD, black phosphorus quantum dot; ESR, electron-spin resonance; TEMP, 2,2,6,6-tetramethylpiperidine; DPBF, diphenylisobenzofuran; ADPA, anthracene-9,10-dipropionic acid; MB, methylene blue; BMPO, 5-tert-butoxycarbonyl-5-methyl-1-pyrroline-N-oxide.
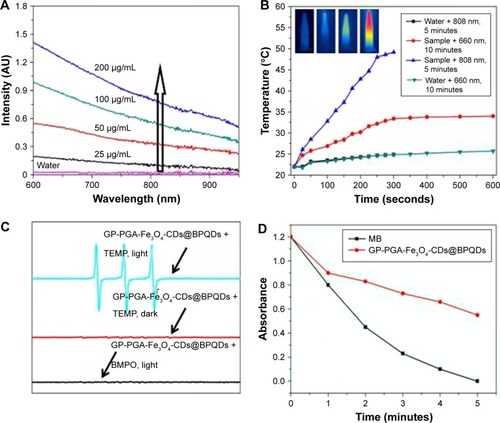
Figure 4 Blood biocompatibility and cell imaging of GP-PGA-Fe3O4-CDs@BPQDs nanoplatform.
Notes: (A) Hemolysis percentages of RBCs by GP-PGA-Fe3O4-CDs@BPQDs at different concentrations (upper right). Inset, supernatant from the GP-PGA-Fe3O4-CD@BPQD suspensions. (B) Optical images of RBCs treated with GP-PGA-Fe3O4-CDs@BPQDs: a, positive control (deionized water); b, negative control (PBS); c–f, 6.25–100 μg/mL. Scale bar =25 μm. (C) 3D reconstruction of the colocalization of GP-PGA-Fe3O4-CDs@BPQDs inside HepG2 cells after 12 hours. Scale bar =50 μm. (D) Confocal fluorescence images for photoexcitation of internalized red-emitting GP-PGA-Fe3O4-CDs@BPQDs in HeLa cells. Scale bar =25 μm.
Abbreviations: RBCs, red blood cells; GP, genipin; PGA, polyglutamic acid; CDs, carbon dots; BPQDs, black phosphorus quantum dots; DAPI, 4,6-diamidino-2-phenylindole.
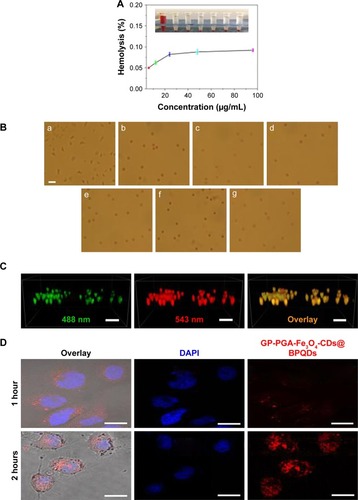
Figure 5 In vitro and vivo toxicity of GP-PGA-Fe3O4-CDs@BPQDs nanoplatform.
Notes: (A) Relative viability of C6, HeLa, A549, and MCF7 cells treated with GP-PGA-Fe3O4-CD@BPQD nanomicelles. (B) Flow-cytometry analysis of C6, HeLa, A549, and MCF7 cells before and after incubation with GP-PGA-Fe3O4-CDs@BPQDs. (C) Comparison of organ indices of mice treated with PBS, healthy, and GP-PGA-Fe3O4-CD@BPQD groups after 30 days. H&E-stained images of major organs from PBS, healthy mice, and mice treated with GP-PGA-Fe3O4-CDs@BPQDs, taken 5 days (D) and 30 days (E). (F) Biodistribution of P in the major organs of mice with without or GP-PGA-Fe3O4-CD@BPQD injection at different postinjection time points. (G) Blood-circulation data of GP-PGA-Fe3O4-CDs@BPQDs after intravenous injection.
Abbreviations: GP, genipin; PGA, polyglutamic acid; CD, carbon dot; BPQD, black phosphorus quantum dot.
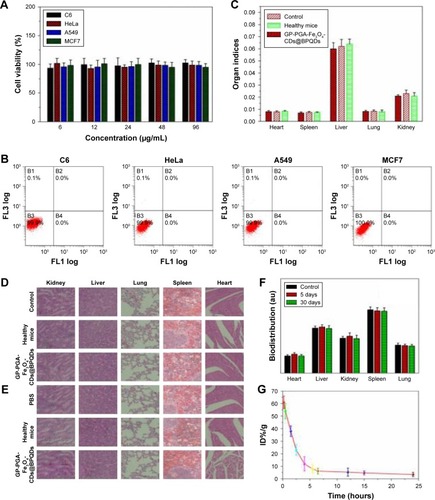
Figure 6 Cell toxicity, and ablation in vitro following incubation with GP-PGA-Fe3O4-CDs@BPQDs.
Notes: (A) Serum biochemistry data for C57BL/6 mice injected with PBS (5 and 30 days postinjection) and GP-PGA-Fe3O4-CDs@BPQDs (5 and 30 days postinjection). (B) ROS generation detected by mean fluorescence for GP-PGA-Fe3O4-CD@BPQD-internalized HeLa cells followed by irradiation with and without NaN3 preprocessing. (C) Tail-DNA and tail-moment analysis. (D) Fluorescence images of calcein AM/PI-stained HeLa cells under various conditions: laser only (a, 0.5 W/cm2), laser only (b, 2 W/cm2), 50 μg/mL GP-PGA-Fe3O4-CDs@BPQDs + laser (c, 660 nm, 0.5 W/cm2, PDT), 50 μg/mL GP-PGA-Fe3O4-CDs@BPQDs + laser (d, 808 nm, 2 W/cm2, PTT), and 50 μg/mL GP-PGA-Fe3O4-CDs@BPQDs + laser (e, 660 + 808 nm, PDT/PTT). Scale bar =100 μm. (E) Relative viability of HeLa cells under various conditions: laser only (a, 0.5 W/cm2), laser only (b, 2 W/cm2), 50 μg/mL GP-PGA-Fe3O4-CDs@BPQDs + laser (c, 660 nm, 0.5 W/cm2, PDT), 50 μg/mL GP-PGA-Fe3O4-CDs@BPQDs + laser (d, 808 nm, 2 W/cm2, PTT), and 50 μg/mL GP-PGA-Fe3O4-CDs@BPQDs + laser (e, 660 + 808 nm, PDT/PTT).
Abbreviations: GP, genipin; PGA, polyglutamic acid; CDs, carbon dots; BPQDs, black phosphorus quantum dots; ROS, reactive oxygen species; AM, acetoxymethyl; PI, propidium iodide; PDT, photodynamic therapy; PTT, photothermal therapy; Cr, creatinine; ALT, alanine aminotransferase; TB, total bilirubin; AST, aspartate aminotransferase; con, concentration.
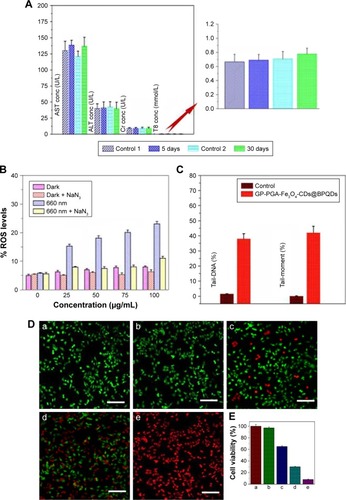
Figure 7 The distribution and biodistribution of GP-PGA-Fe3O4-CDs@BPQDs after injection.
Notes: (A) Field-dependent magnetization loop of GP-PGA-Fe3O4-CD@BPQD nanoparticles. Inset photos show the separation process under the magnetic field. The red circle indicates the adsorbed GP-Fe3O4-CDs@BPQDs. (B) Linear fitting of 1/T2 of GP-PGA-Fe3O4-CDs@BPQDs with different Fe concentrations. Inset: T2-weighted MRI. (C) In vivo T2-weighted MRI and color-mapped images of mice bearing tumors after intravenous injection of GP-PGA-Fe3O4-CDs@BPQDs at different time intervals. (D) Real-time in vivo fluorescence images at different injection time. (D) Confocal microscopy of tumor sections after subcutaneous injection of GP-PGA-Fe3O4-CDs@BPQDs. Scale bar =100 nm.
Abbreviations: GP, genipin; PGA, polyglutamic acid; CD, carbon dot; BPQD, black phosphorus quantum dot; MRI, magnetic resonance imaging.
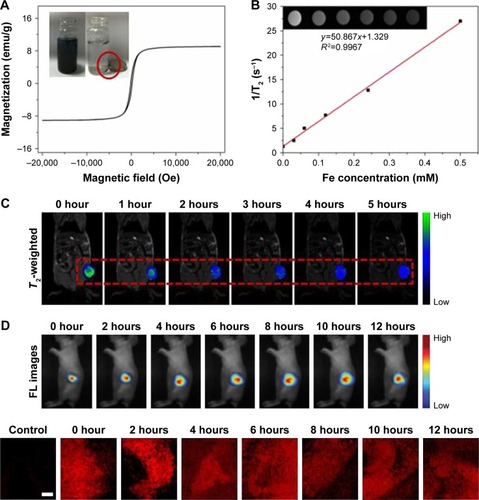
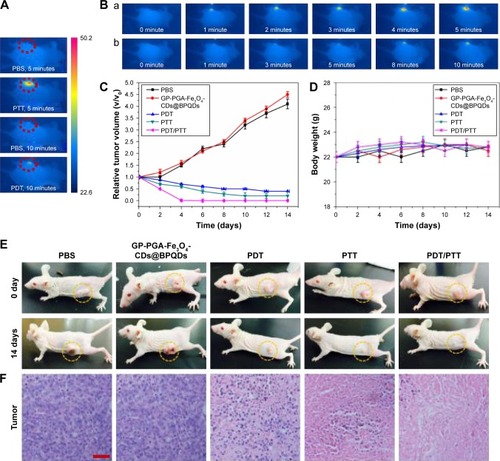
Figure 8 Therapeutic effects of GP-PGA-Fe3O4-CDs@BPQDs in mice exposed to NIR after injection.
Notes: (A) Highest temperature within the tumor area recorded by an IR camera after 660 or 808 nm laser irradiation. (B) Thermography of tumor-bearing mice receiving photothermal treatment for different periods: a, 808 nm, 2.0 W/cm2, 5 min; b, 660 nm, 0.5 W/cm2, 10 min. (C) Weight-growth curves. Mice were measured every 2 days. (D) Tumor growth curves (n=5). Measurements taken after different treatments. (E) Mice with HeLa tumors after various treatments. (F) H&E staining of tumor sections collected from different treatment groups. Scale bar =50 μm.
Abbreviations: GP, genipin; PGA, polyglutamic acid; CDs, carbon dots; BPQDs, black phosphorus quantum dots; NIR, near-infrared; PTT, photothermal therapy; PDT, photodynamic therapy.