Figures & data
Figure 1 Fourier transform infrared spectrum of (A) dendrimer-G2, (B) glutamine, and (C) dendrimer–glutamine.
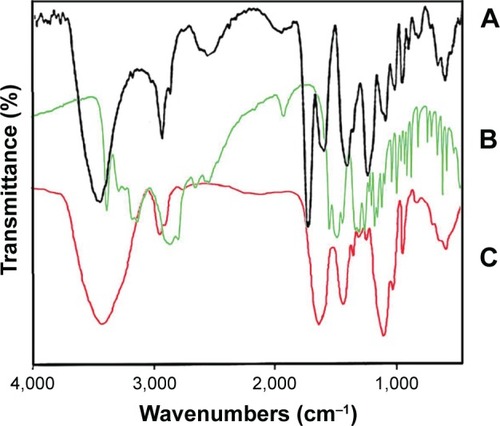
Figure 2 The 1H-NMR spectrum of (A) glutamine, (B) dendrimer-G2, (C) dendrimer–glutamine, and (D) 13C-NMR of dendrimer–glutamine.
Abbreviation: NMR, nuclear magnetic resonance.
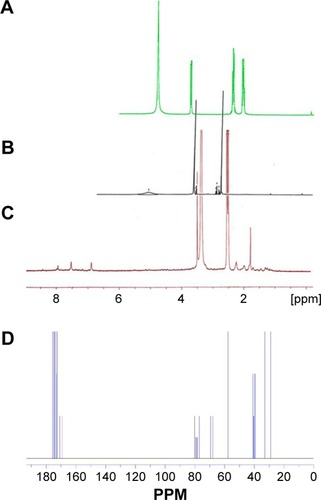
Figure 3 Liquid chromatography-mass spectroscopy of glutamine conjugated to dendrimer-G2.
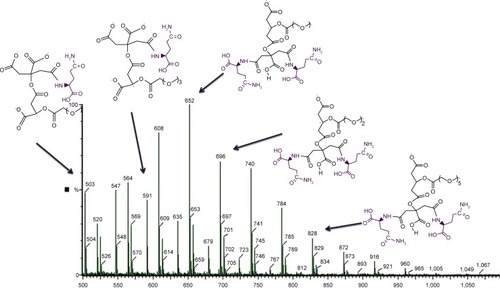
Figure 4 Debye plot of glutamine conjugated to dendrimer-G2.
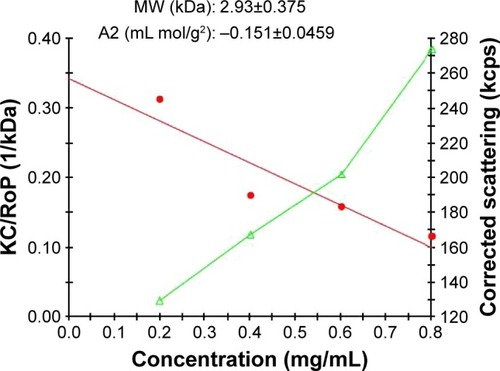
Figure 5 (A) Size and (B) zeta potential. Red and black colors show the nanoconjugate and intact dendrimer, respectively.
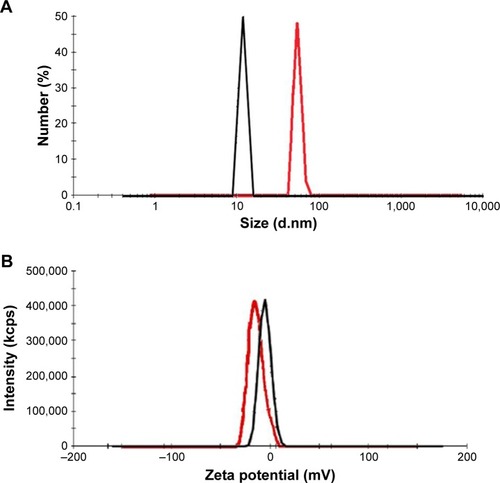
Figure 6 Atomic force microscopy image of the (A) dendrimer and (B) nanoconjugate.
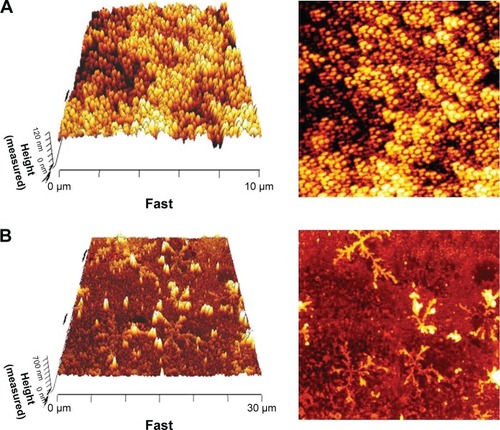
Figure 7 XTT assay: (A) A549 and (B) HEK-293 cells were exposed to the nanoconjugate for 24 and 48 hours.
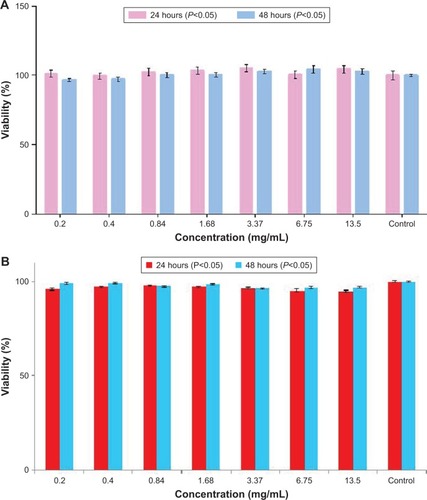
Figure 8 Apoptosis/necrosis assay plots of A549 cells treated with 5.5 mg/mL of the nanoconjugate after 48 hours of incubation time.
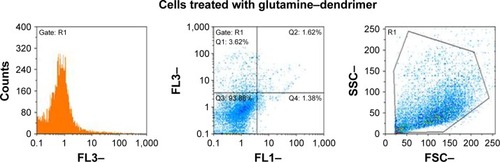
Figure 9 In vitro stability of 99mTc nanoconjugate complex in human serum at 37°C and PBS at room temperature.
Abbreviation: PBS, phosphate buffered saline.
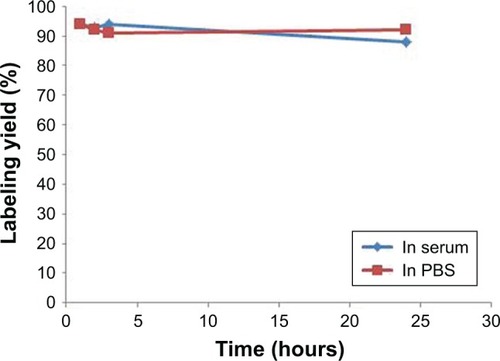
Table 1 Biodistribution profile of nanoconjugate at different times (dose per gram of tissue). Data expressed as percentage ID⁄g±SD (n=3)
Figure 10 Planar images with 99mTc nanoconjugate in mice acquired at different time intervals up until 1 hour after injection: (A) anterior, (B) posterior. The arrows indicate the tumor site.
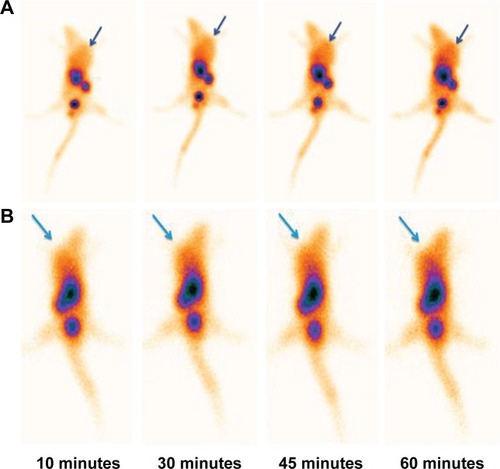
Figure 11 Transverse, sagittal and coronal imaging of nude mice bearing A549 tumor 1 hour after injection of 3.7 MBq of radiolabeled nanoconjugate. Arrows indicate the tumor position.
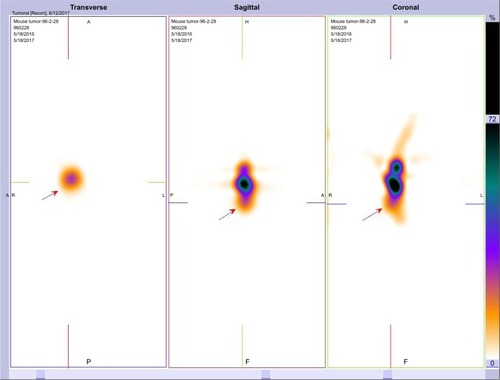
Figure 12 Tumor imaging of nude mice bearing A549 tumor 1 hour after injection of 3.7 MBq of 99mTc nanoconjugate (A) without and (B) with coadministration of 10 mg/mL of glutamine (glutamine blocking). The arrows indicate the tumor site.
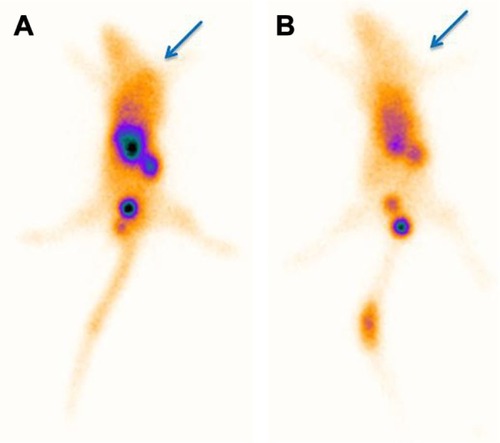
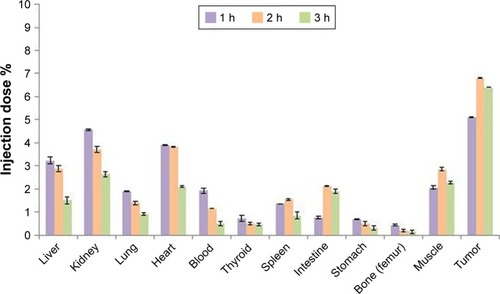
Figure 13 Biodistribution profile of nanoconjugate at different time intervals (dose per gram of tissue). P-value <0.05 was observed among various tissues.
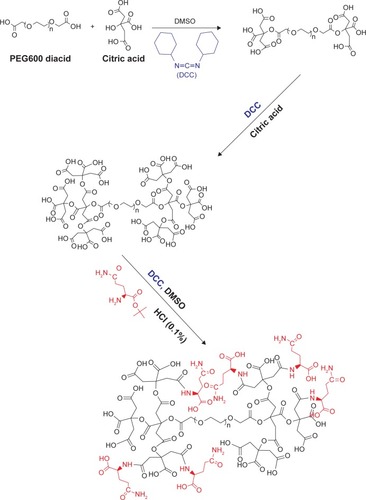
Scheme 1 The preparation routes of dendrimer-G2 and glutamine conjugation.
Abbreviations: DCC, N, N′-dicyclohexylcarbodiimide; DMSO, dimethyl sulfoxide.