Figures & data
Figure 1 (A) T1-weighted MRI of MNP-Mn(II) and Omniscan aqueous solutions. (B) Plots of T1 relaxation rates (1/T1) for MNP-Mn(II) and Omniscan aqueous suspensions based on metal ion (ie, Mn2+, Gd3+) concentrations (mM). The slope of each regression represents the relaxivity (ie, r1).
Abbreviations: MNP-Mn(II), manganese (II) ions chelated to melanin nanoparticles; MRI, magnetic resonance imaging.
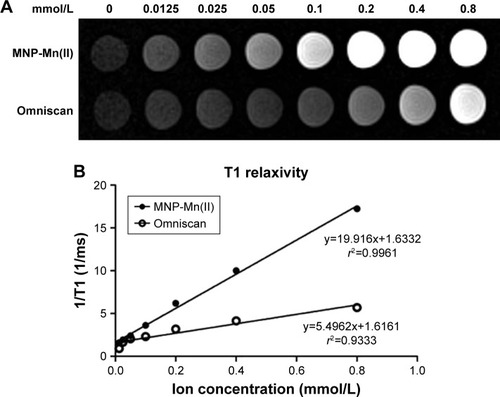
Figure 2 Confocal microscopy image of MNP-Mn(II)-rhodamine-B-labeled BMSCs. (A) Rhodamine (red) in the cytoplasm, (B) cell nuclei (stained by DAPI, blue), and (C) merged image; scale bars =25 µm.
Abbreviations: BMSCs, bone marrow-derived stem cells; DAPI, 4′,6-diamidino-2-phenylindole; MNP-Mn(II), manganese (II) ions chelated to melanin nanoparticles.
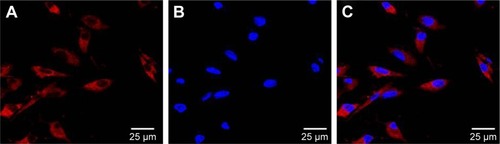
Figure 3 TEM images of MNP-Mn(II)-labeled BMSCs and unlabeled BMSCs; scale bars =2 µm. (A) Black particles representing the internalized MNP-Mn(II) were observed in the cytoplasm and endosomes of labeled BMSCs (enlarged in the upper right corner). (B) No black particles were observed in endosomes of unlabeled BMSCs.
Abbreviations: BMSCs, bone marrow-derived stem cells; MNP-Mn(II), manganese (II) ions chelated to melanin nanoparticles; TEM, transmission electron microscopy.

Figure 4 Cytotoxicity assessment of BMSCs labeled with MNP-Mn(II) at various concentrations (0, 25, 50, 100, 200, 400, 800, and 1,600 µg/mL) was performed using CCK-8 assays. The relative cell viability was estimated by measuring the optical density of each well at 450 nm.
Abbreviations: BMSCs, bone marrow-derived stem cells; CCK-8, Cell Counting Kit-8; MNP-Mn(II), manganese (II) ions chelated to melanin nanoparticles.
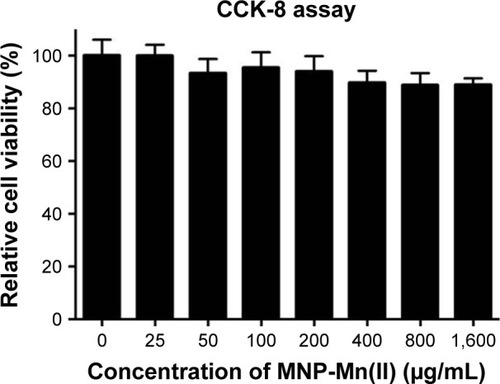
Figure 5 (A) T1-weighted images of BMSCs labeled with MNP-Mn(II) at various concentrations (0, 100, 200, 400, and 800 µg/mL) in vitro. PBS was used as the control group. (B) MRI signal intensity of BMSCs labeled with MNP-Mn(II) at various concentrations (0, 100, 200, 400, and 800 µg/mL).
Abbreviations: BMSCs, bone marrow-derived stem cells; MNP-Mn(II), manganese (II) ions chelated to melanin nanoparticles; MRI, magnetic resonance imaging; PBS, phosphate-buffered saline.
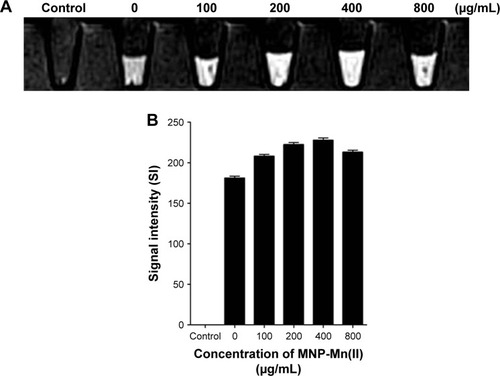
Figure 6 (A) T1WIs of rats before MNP-Mn(II)-labeled BMSCs were injected into the right hip. T1WIs of rats after MNP-Mn(II)-labeled BMSCs were injected into the right hip on days 1, 4, 7, 14, 21, and 28. Hyperintense T1 signals in the right hip represented the presence of engrafted MNP-Mn(II)-labeled BMSCs in vivo. (B) The relative signal intensity of the MNP-Mn(II)-labeled BMSC injection region and the adjacent soft tissue over time. (C) The area of time-dependent hyperintense signals generated by MNP-Mn(II)-labeled BMSCs.
Abbreviations: BMSCs, bone marrow-derived stem cells; MNP-Mn(II), manganese (II) ions chelated to melanin nanoparticles; MRI, magnetic resonance imaging; PBS, phosphate-buffered saline; WI, weighted image.
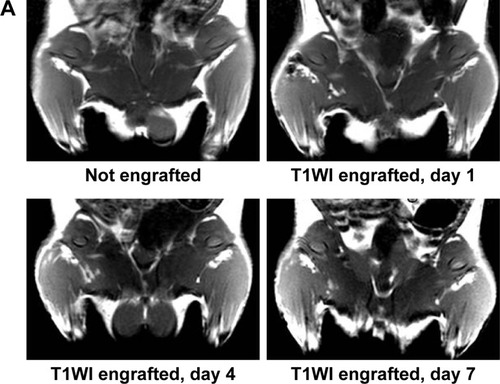
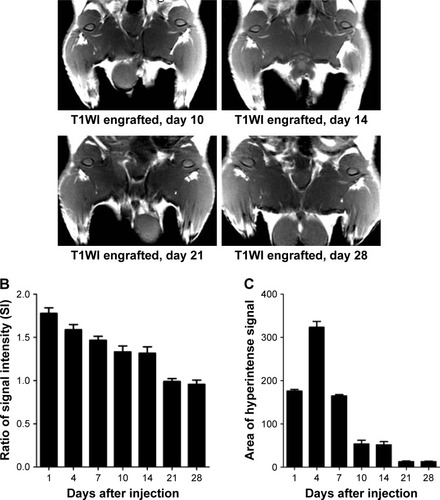
Figure S1 Characterization of the physical properties of Mn2+-PEG-MNPs. (A) From left to right: 2 mg/mL PEG-MNPs and 2 mg/mL Mn2+-PEG-MNPs. (B) TEM image of Mn2+-PEG-MNPs (scale bar =50 nm). (C) TEM image of MNPs (scale bar =50 nm). (D) Particle-size distribution of Mn2+-PEG-MNPs. (E) Stability analysis of Mn2+-PEG-MNPs in PBS (pH =7.4).
Abbreviations: DLS, dynamic light scattering; h, hours; MNPs, melanin nanoparticles; PBS, phosphate-buffered saline; PEG, polyethylene glycol; TEM, transmission electron microscope.
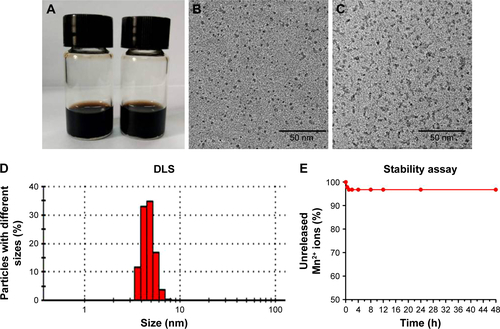
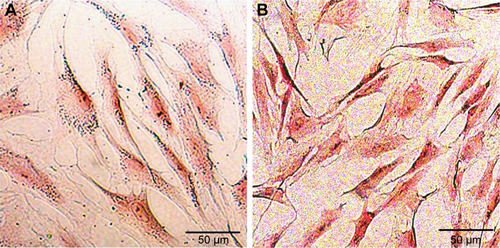
Figure S2 Fontana–Masson staining of Mn2+-PEG-MNP-labeled and unlabeled BMSCs. (A) Black particles representing Mn2+-PEG-MNPs were observed in the cytoplasm of labeled BMSCs. (B) Black particles were not observed in the cytoplasm of labeled BMSCs. Magnification =200×. Scale bars =50 µm.
Abbreviations: BMSCs, bone marrow-derived stem cells; MNPs, melanin nanoparticles; PEG, polyethylene glycol.