Figures & data
Table 1 Primers used for quantitative real-time polymerase chain reaction
Figure 1 SEM images of composite scaffolds (WP0%, m_MS:PCL:WP =30:70:0 w/w; WP15%, m_MS:PCL:WP =30:55:15 w/w; WP30%, m_MS:PCL:WP =30:40:30 w/w) at different magnifications (×50, ×100, and ×300).
Abbreviations: SEM, scanning electron microscopy; m_MS:PCL:WP, mesoporous magnesium/polycaprolactone/wheat protein; WP, wheat protein; w/w, weight per weight.
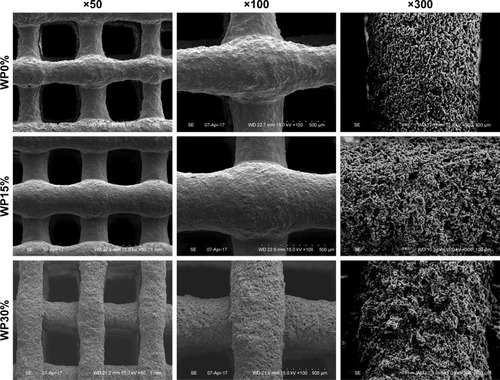
Figure 2 (A) Contact angle and (B) compressive modulus of scaffolds (n≥3).
Note: *P<0.05.
Abbreviations: PCL, polycaprolactone; WP, wheat protein.
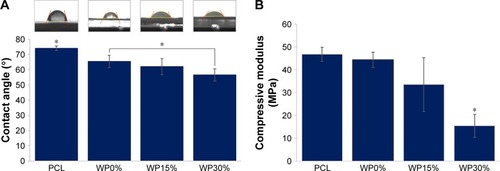
Figure 3 (A) Water absorption and (B) weight loss of m_MS/PCL/WP scaffolds soaked in PBS for different periods (n=3).
Note: *P<0.05.
Abbreviation: m_MS/PCL/WP, mesoporous magnesium/polycaprolactone/wheat protein.
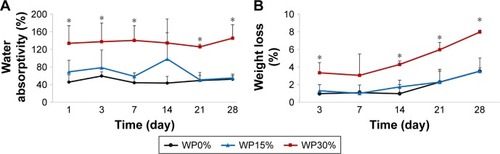
Figure 4 SEM images of the surface morphology of each scaffold (WP0%, WP15%, and WP30%) after soaking in SBF solution for 7 days at different magnifications (×100 and ×1500).
Abbreviations: SEM, scanning electron microscopy; WP, wheat protein; SBF, simulated body fluid.
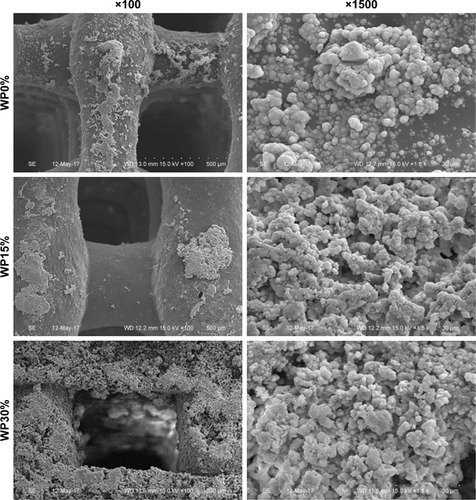
Figure 5 Cytotoxic evaluation of each scaffold with L929 mouse fibroblast-like cells in comparison with negative control (PCL extracts and DMEM alone) and positive control (dilute phenol) for 24 h (n≥4).
Note: *P<0.05.
Abbreviation: PCL, polycaprolactone.
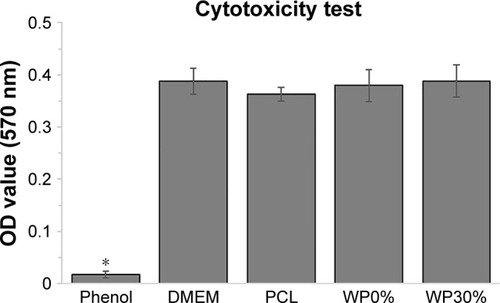
Figure 6 Confirmation of viability and cell alignment of MSCs on each scaffold using live (green)/dead (red) assay on day 7.
Notes: Magnification ×100; scale bar =100 µm.
Abbreviations: MSCs, mesenchymal stem cells; WP, wheat protein.
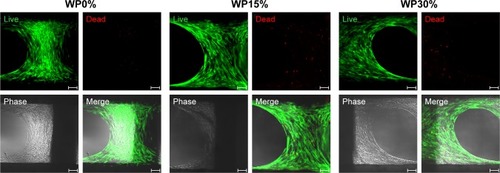
Figure 7 DNA content reflecting the proliferation of MSCs cultured on each scaffold for up to 14 days (n=5).
Note: *P<0.05.
Abbreviations: MSCs, mesenchymal stem cells; WP, wheat protein.
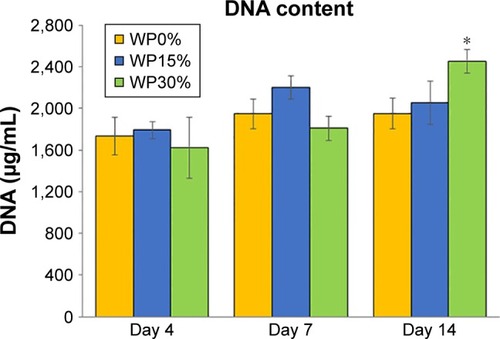
Figure 8 ALP activity of MSCs after cultivating for 7 and 14 days on each scaffold (n=5).
Note: *P<0.05.
Abbreviations: ALP, alkaline phosphatase; MSCs, mesenchymal stem cells; WP, wheat protein.
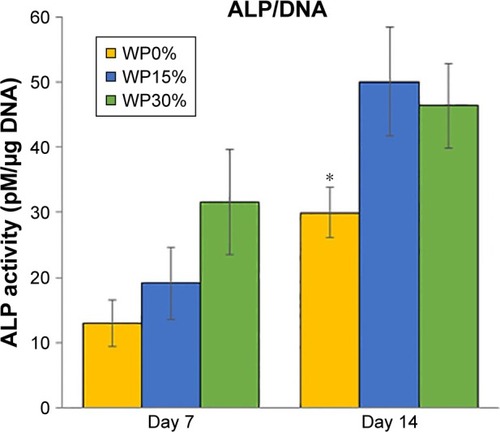
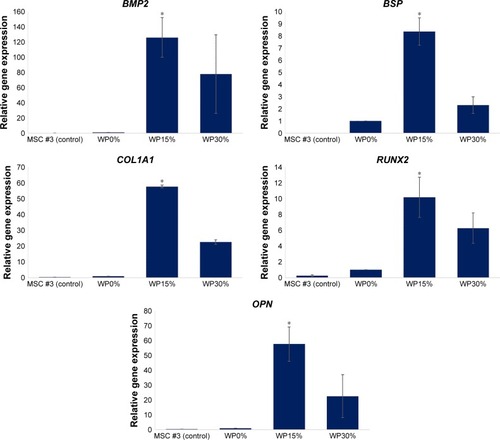
Figure 9 Gene expression levels of osteogenic markers, such as BMP2, BSP, COL1A1, RUNX2, and OPN, in MSCs cultured for 14 days (n=3, *P<0.05).
Abbreviations: BMP2, bone morphogenetic protein 2; BSP, bone sialoprotein; COL1A1, collagen type I alpha I chain; RUNX2, runt-related transcription factor 2; OPN, osteopontin; MSC, mesenchymal stem cells; WP, wheat protein.