Figures & data
Figure 1 Schematic of the anodization system.
Abbreviation: HF, hydrofluoric acid.
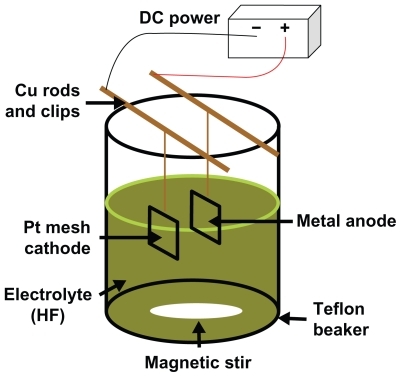
Figure 2 Scanning electron microscope micrographs of A) 20 nm and B) 80 nm anodized nanotubular titanium, as well as C) conventional titanium. Scale bars = 200 nm.
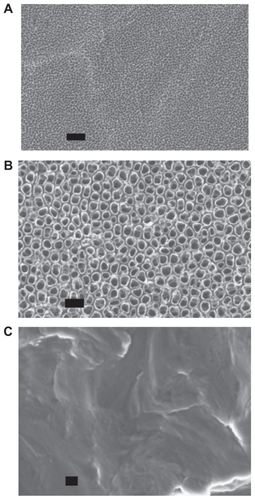
Table 1 Qualitative data obtained from AFM analysis indicating that substrates created by anodization contained more nanofeatured surface features than conventional titanium
Figure 3 Atomic force microscopy micrographs showing the topography of A) and B) 20 nm, C) and D) 80 nm, and E) and F) conventional titanium. The images in A, C), and E) show higher magnification scans, highlighting the nanotopography of the samples, and the images in B, D), and F) show lower magnification scans, highlighting the micron-topography of the samples.
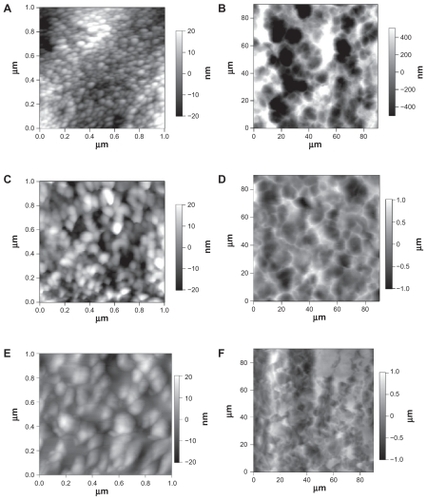
Table 2 Atomic percentages of elements in the outermost layers, as determined by ESCA
Figure 4 Electron spectroscopy for chemical analysis for A) 20 nm, B) 80 nm anodized nanotubular titanium, and C) conventional titanium.
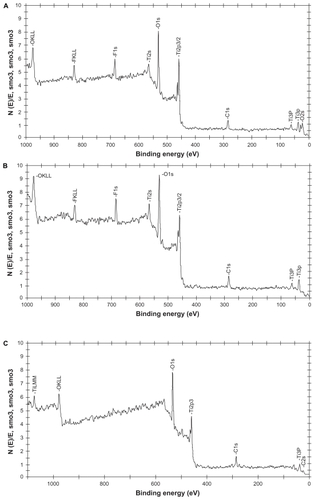
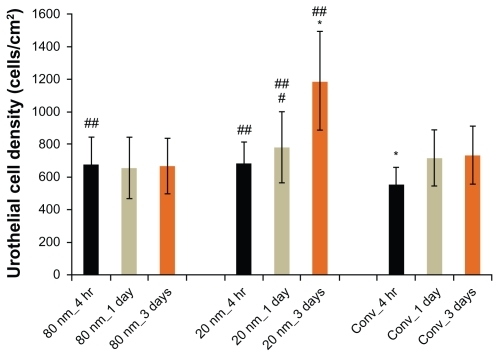
Figure 5 Urothelial cell densities from 4 hours to 3 days on 20 nm and 80 nm diameter anodized nanotubular titanium, as well as conventional titanium.
Notes: Data are mean ± SEM n = 3; *P < 0.01 compared to respective counterparts at the same time period; #P < 0.05 compared to respective sample 4-hour time point; ##P < 0.05 compared to conventional titanium at the respective time point. Conv. = conventional titanium. Statistics evaluated using Student t-tests.