Figures & data
Figure 1 SEM morphologies of the HAp microspheres (A, B) and the nHAp microspheres obtained via hydrothermal treatment of the CS microspheres in Na3PO4 aqueous solution at 180°C for 24 h (C, D).
Abbreviations: CS, calcium silicate; HAp, hydroxyapatite; nHAp, nanostructured Hap; SEM, scanning electron microscopy.
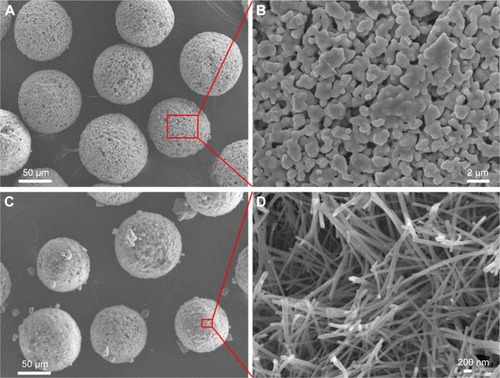
Figure 2 XRD patterns of the CS microspheres (A) and the nHAp microspheres obtained via hydrothermal treatment of the CS microspheres in Na3PO4 aqueous solution at 180°C for 24 h (B).
Abbreviations: CS, calcium silicate; HAp, hydroxyapatite; nHAp, nanostructured hydroxyapatite; XRD, X-ray diffraction.
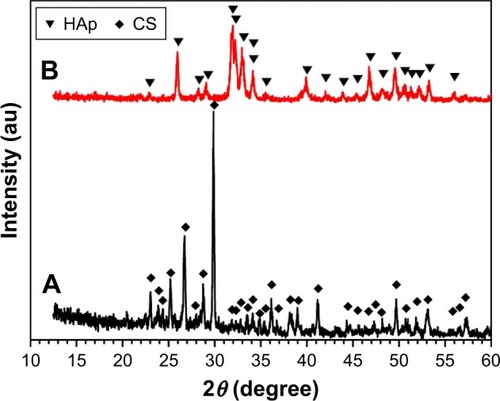
Figure 3 FTIR spectrum of the nHAp microspheres obtained via hydrothermal treatment of the CS microspheres in Na3PO4 aqueous solution at 180°C for 24 h.
Abbreviations: CS, calcium silicate; FTIR, Fourier transform infrared; nHAp, nanostructured hydroxyapatite.
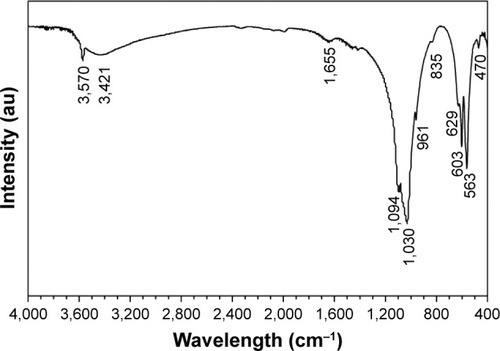
Figure 4 The amount of loaded rhBMP-2 on 1 g HAp and nHAp microspheres (A). Cumulative in vitro release curves of the HAp and nHAp microspheres over a period of 12 days (B). *Significant differences, P < 0.05.
Abbreviations: HAp, hydroxyapatite; nHAp, nanostructured HAp; rhBMP-2, recombinant human bone morphogenetic protein-2.
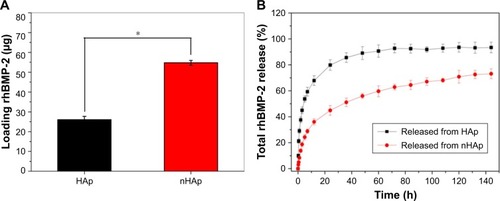
Figure 5 3D micro-CT reconstruction of bone regeneration in the femoral bone defect from animals with the most new bone formation (A). The defect sites were analyzed to calculate the BMD (B) and the percentage of new BV relative to TV (BV/TV) (C) (n = 3 rats/batch). *Significant differences, P < 0.05.
Abbreviations: BMP, bone morphogenetic protein; HAp, hydroxyapatite; nHAp, nanostructured HAp; BMD, bone mineral density; BV, bone volume; CT, computed tomography; 3D, three-dimensional; TV, tissue volume; w, weeks.
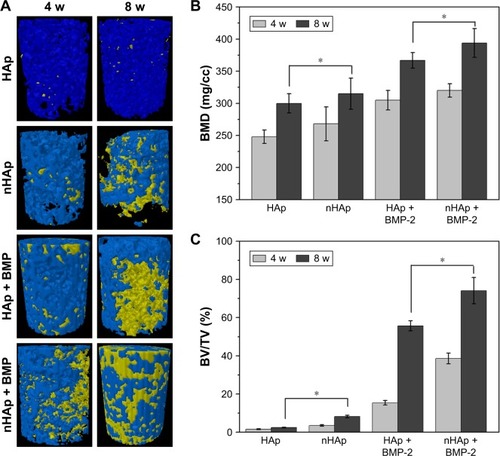
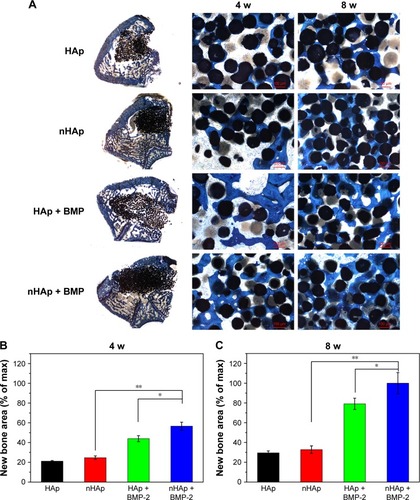
Figure 6 Histological images of newly formed bone in femoral bone defect at 4 and 8 weeks after operation (A). The percentage of new bone area assessed at 4 (B) and 8 weeks (C) after implantation by histomorphometric analysis. All the new bone area data were normalized to the percentage of maximum new bone area value. *Significant differences, P < 0.05; scale bar = 100 μm. **Significant differences, P < 0.01.
Abbreviations: BMP-2, bone morphogenetic protein-2; HAp, hydroxyapatite; nHAp, nanostructured HAp; w, weeks.