Figures & data
Figure 1 Cell viability of glioblastoma LN229 cells treated with different sizes of SiNPs for 24 hours and 48 hours.
Notes: MTT test results for cells treated with 7 nm SiNPs (A), 5–15 nm SiNPs (B), and 10–20 nm SiNPs (C). Cells were incubated with various concentrations of SiNPs: 5–1,800 μg/mL. The results represent means for pooled triplicate values from three independent experiments. *P<0.05.
Abbreviation: SiNPs, silicon dioxide nanoparticles.
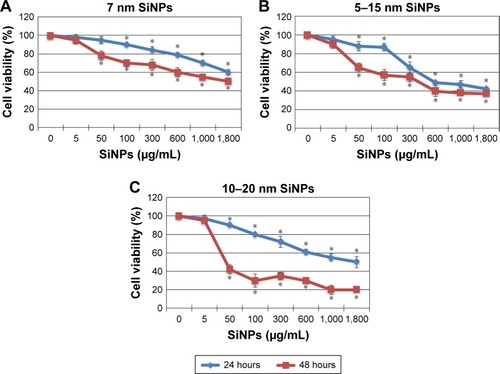
Figure 2 TEM images of synthetic SiNPs in dry form (A, B), dispersed in water (C, D), and dispersed in DMEM containing 10% FBS (E, F).
Notes: SiNPs are shown to have a tendency to form aggregates, dependently on the dispersion medium. The biggest agglomerates with the largest particles are present in DMEM. Representative images from the FEI Tecnai G2 X-Twin microscope are shown. Magnifications: 34,000× (A, C, E) and 130,000× (B, D, F).
Abbreviations: TEM, transmission electron microscopy; SiNPs, silicon dioxide nanoparticles.
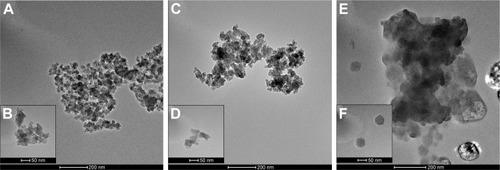
Figure 3 Effect of 5–15 nm SiNPs on apoptosis of glioblastoma LN229 cells.
Notes: Cells were incubated with 50 μg/mL and 100 μg/mL SiNPs for 24 hours and 48 hours. Phenotypic characteristics of LN229 cells after 24 hours and 48 hours of SiNP treatment are presented. Morphological effects induced by 50 μg/mL and 100 μg/mL SiNP treatment were evaluated by AO–EtBr staining and visualized by fluorescence microscopy (magnification 200×). After 48 hours, reduced cell density with a majority of red-stained nuclei cells indicative of apoptosis is observable (A). Flow-cytometry analysis of LN229 cells incubated with 50 μg/mL and 100 μg/mL SiNPs for 24 hours and 48 hours. Representative FACS images of cells subjected to annexin V–FITC/propidium iodide staining (B). Percentage of early and late apoptotic LN229 cells (C). Caspase 3/7 activity in LN229 cells exposed to 50 μg/mL and 100 μg/mL SiNPs for 24 hours and 48 hours (D). Mean ± SD from three independent experiments are shown. *P<0.05.
Abbreviations: SiNPs, silicon dioxide nanoparticles; AO, acridine orange; EtBr, ethidium bromide; FACS, fluorescence-activated cell sorting; FITC, fluorescein isothiocyanate.
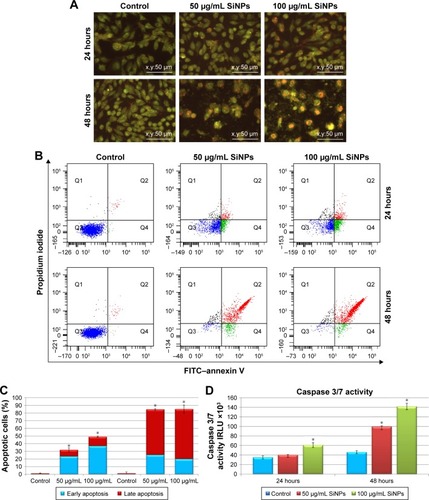
Figure 4 Effect of 5–15 nm SiNPs on ER stress in glioblastoma LN229 cells.
Notes: RT-qPCR analysis of HSPA5 (A) and DDIT3 (B) genes. Cells were treated with 50 μg/mL and 100 μg/mL SiNPs, and total RNA was extracted from LN229 cells cultured for 24 hours or 48 hours. Results shown as relative fold change in mRNA expression in comparison to untreated controls, where expression level was set as 1. *P<0.05. Western blot analysis of GRP78 and GRP94 expression in glioblastoma cells incubated with 50 μg/mL and 100 μg/mL SiNPs for 24 hours and 48 hours (C). Samples containing 20 μg protein were submitted to electrophoresis and immunoblotting. Representative Western blot images are presented. β-Tubulin was used as the loading control.
Abbreviations: SiNPs, silicon dioxide nanoparticles; ER, endoplasmic reticulum; RT-qPCR, reverse-transcription quantitative polymerase chain reaction.
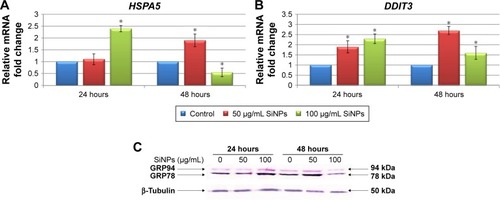
Figure 5 Effect of 5–15 nm SiNPs on oxidative stress and mitochondria dysfunction of glioblastoma LN229 cells.
Notes: ROS generation in LN229 cells subjected to treatment with 50 μg/mL and 100 μg/mL SiNPs for 24 hours and 48 hours (A). RT-qPCR analysis of antioxidant-enzyme genes SOD1, SOD2, and CAT in cells treated for 24 (B) and 48 (C) hours. Results shown as relative fold change in mRNA expression in comparison to untreated controls, where expression level was set as 1. Representative FACS data for LN229 cells subjected to JC1 staining (D). Gate P4 indicates cell population with normal ΔΨm, and gate P5 shows cell population with decreased ΔΨm. Percentage of cells with decreased ΔΨm (E). ATP levels in LN229 cells treated with SiNPs for 24 hours and 48 hours (F). RT-qPCR analysis of genes related to mitochondria dysfunction – BAX, BCL2L11, PUMA, NOXA, BCL2, and BCL2L1 – in cells treated for 24 (G) and 48 (H) hours. Results shown as relative fold change in mRNA expression in comparison to untreated controls, where expression level was set as 1. Caspase 9 activity (I). Mean values from three independent experiments ± SD are shown. *P<0.05.
Abbreviations: SiNPs, silicon dioxide nanoparticles; ROS, reactive oxygen species; RT-qPCR, reverse-transcription quantitative polymerase chain reaction; FACS, fluorescence-activated cell sorting; FITC, fluorescein isothiocyanate; PE, phycoerythrin; ΔΨm, mitochondrial membrane potential; JCI, 5,5,6,6-tetrachloro-1,1,3,3-tetraethylbenzimidazolcarbocyanine iodide.
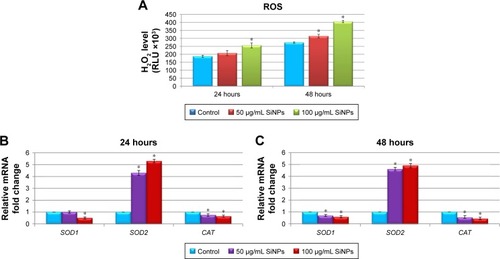
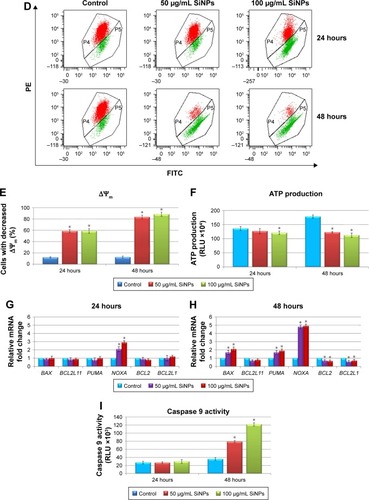
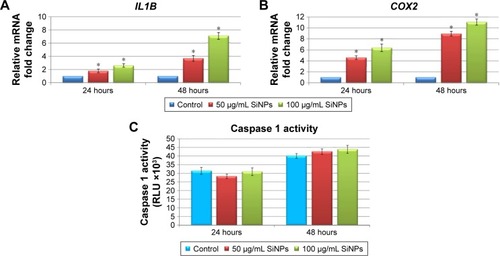
Figure 6 Effect of 5–15 nm SiNPs on inflammatory response of glioblastoma LN229 cells.
Notes: RT-qPCR analysis of proinflammatory genes IL1B (A) and COX2 (B). Cells were treated with 50 μg/mL and 100 μg/mL SiNPs, and total RNA was extracted from LN229 cells cultured for 24 hours or 48 hours. Results shown as relative fold change in mRNA expression in comparison to untreated controls, where expression level was set as 1. Caspase 1 activity detected in LN229 cells treated with 50 μg/mL and 100 μg/mL of SiNPs for 24 hours and 48 hours (C). Results presented as relative luminescence units and compared to untreated controls. *P<0.05.
Abbreviations: SiNPs, silicon dioxide nanoparticles; RT-qPCR, reverse-transcription quantitative polymerase chain reaction.