Figures & data
Figure 1 Schematic of formation of free paclitaxel-loaded PGG–PTX nanoparticles.
Abbreviations: PGG, poly(L-γ-glutamylglutamine); PTX, paclitaxel.
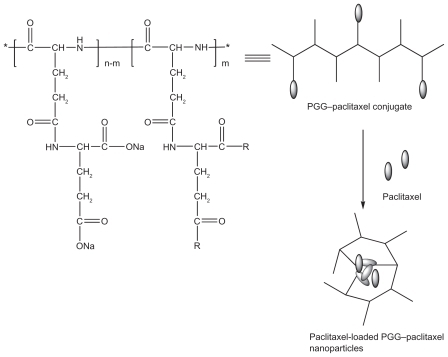
Figure 2 A) 1H-NMR spectra of paclitaxel in CD3OD; B) PGG–PTX nanoconjugate in D2O; C) paclitaxel-loaded PGG–PTX nanoparticles in D2O; and D) paclitaxel-loaded PGG–PTX nanoparticles in CD3OD.
Note: *Free paclitaxel protons.
Abbreviations: PGG, poly(L-γ-glutamylglutamine); ppm, parts per million; PTX, paclitaxel.

Figure 3 The particle size distribution of PGG–PTX nano-conjugate A) and paclitaxel-loaded PGG–PTX nanoparticles B) measured by DLS.
Abbreviations: d.nm; diameter in nanometers; DLS, dynamic light scattering; PGG, poly(L-γ-glutamylglutamine); PTX, paclitaxel.
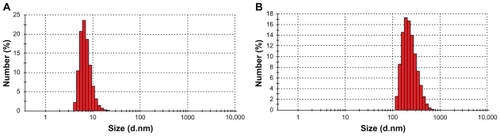
Figure 4 TEM micrograph of the PGG–PTX nanoconjugates a) and paclitaxel–loaded PGG–PTX nanoparticles b).
Abbreviations: PGG, poly(L-γ-glutamylglutamine); PTX, paclitaxel; TEM, transmission electron microscopy.
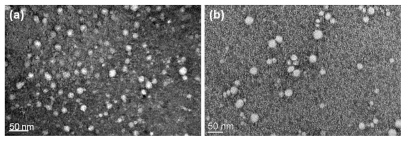
Figure 5 Maximum tolerated dose of paclitaxel-loaded PGG–PTX nanoparticles. Body weight change as a function of time in the normal nu/nu mice (n = 5) with a single IV tail vein injection of either saline (⋄), 210 mg PTX/kg (■), 230 mg PTX/kg (▴), or 250 mg PTX/kg (●) paclitaxel-loaded PGG–PTX nanoparticles. Vertical bars ±SEM.
Abbreviations: IV, intravenous; PGG, poly(L-γ-glutamylglutamine); PTX, paclitaxel; SEM, standard error of the mean.
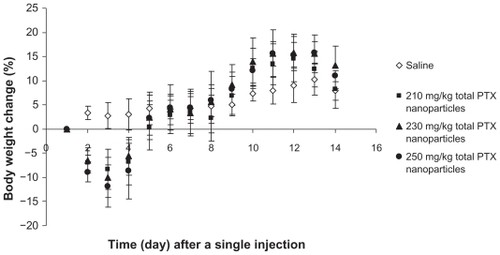
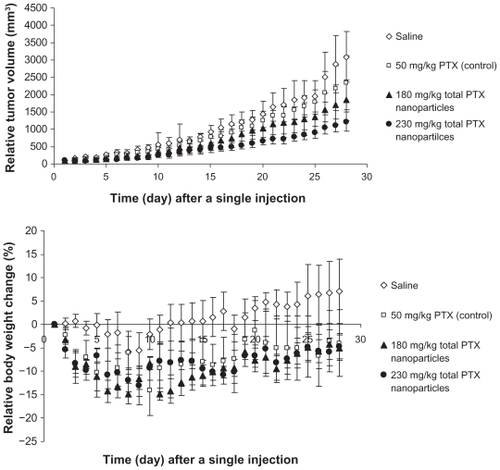
Figure 6 Relative tumor volume (top) and body weight change (bottom) as a function of time in nude mice (n = 6) bearing NCI-H460 tumors treated with a single IV tail vein injection of either saline (⋄), 50 mg PTX/kg (□) (paclitaxel Cremophor–ethanol formulation), 180 mg PTX/kg (▴) (paclitaxel-loaded PGG–PTX nanoparticles), or 230 mg PTX/kg (●) (paclitaxel-loaded PGG–PTX nanoparticles). Vertical bars ±SEM.
Abbreviations: IV, intravenous; PGG, poly(L-γ-glutamylglutamine); PTX, paclitaxel; SEM, standard error of the mean.