Figures & data
Table 1 Mathematical models used for linearization of the photosensitizer release profile data
Figure 1 Photographs of TEM. A) and C) ZnPc-loaded PCL nanoparticles; B) and D) empty nanoparticles.
Abbreviations: TEM, transmission electron microscopy; ZnPc, zinc phthalocyanine; PCL, poly-ɛ-caprolactone.
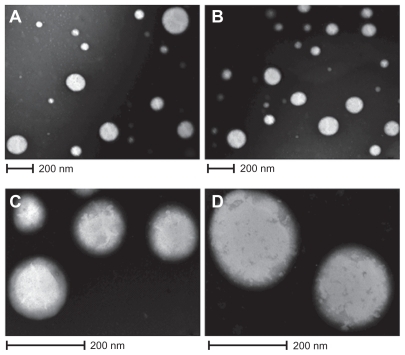
Figure 2 A) In vitro releasing profile of the ZnPc from nanostructured system. B) Graphic representation of the Higuchi model obtained after regression. Mean and SD of n = 6 determinations.
Abbreviations: ZnPc, zinc phthalocyanine; SD, standard deviation.
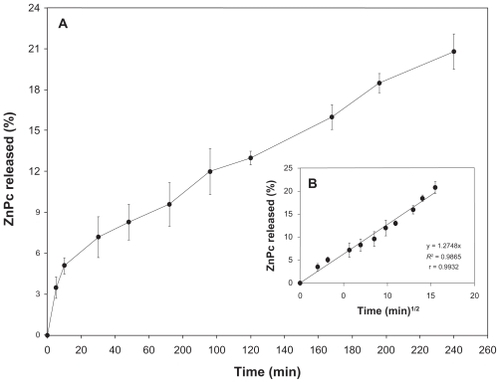
Table 2 Released drug in the acceptor solution and remaining content of photosensitizer in the nanoparticles
Table 3 Determination coefficient (R2) and correlation coefficient (r) obtained after linear regression of the release data
Figure 3 Influence of the incubation time (h) in the phototoxicity of free ZnPc or ZnPc-loaded nanoparticles. The cells were incubated with 5 μg (250 μL) of free ZnPc and ZnPc-loaded nanoparticles at different times, washed, and irradiated at a light dose of 100 J/cm2. Dark toxicity was studied for all samples. The MTT assay was performed 24 h after light exposure. Each data point represents the mean (±SD) of n = l0 determinations.
Notes: *Significant difference (P < 0.05), **No significant difference (P > 0.05).
Abbreviations: ZnPc, zinc phthalocyanine; MTT, 3-(4,5-dimethyl-thiazol-2-yl)-2,5-biphenyl tetrazolium bromide; MB, methylene blue; SD, standard deviation.
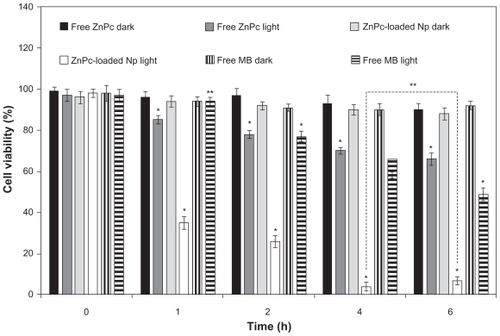
Figure 4 Influence of the photosensitizer concentration in the photobiological activity of free ZnPc, free MB, or ZnPc-loaded nanoparticles. The cells were incubated with 250 μL of free photosensitizer (ZnPc or MB) and ZnPc-loaded nanoparticles for 4 h, washed, and irradiated at a light dose of 100 J/cm2. Dark toxicity was studied for all samples. The MTT assay was performed 24 h after light exposure. Each data point represents the mean (±SD) of n = 10 determinations.
Notes: *Significant difference (P < 0.05), **No significant difference (P > 0.05).
Abbreviations: ZnPc, zinc phthalocyanine; MB, methylene blue; MTT, 3-(4,5-dimethyl-thiazol-2-yl)-2,5-biphenyl tetrazolium bromide; SD, standard deviation.
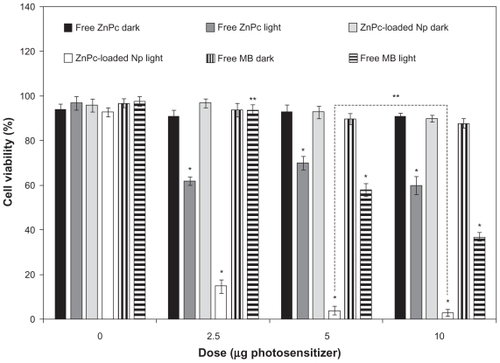
Figure 5 Influence of light dose on phototoxicity of free ZnPc and ZnPc-loaded nanoparticles. The cells were incubated for 4 h, at an equivalent drug dose of 5-pg ZnPc (250 μL), washed, and irradiated with red light (660 nm). MTT assay was performed 24 h after light exposure. Each data point represents the mean (±SD) of n = 10 determinations.
Notes: *Significant difference (P < 0.05), **No significant difference (P > 0.05).
Abbreviations: ZnPc, zinc phthalocyanine; MTT, 3-(4,5-dimethyl-thiazol-2-yl)-2,5-biphenyl tetrazolium bromide; SD, standard deviation.
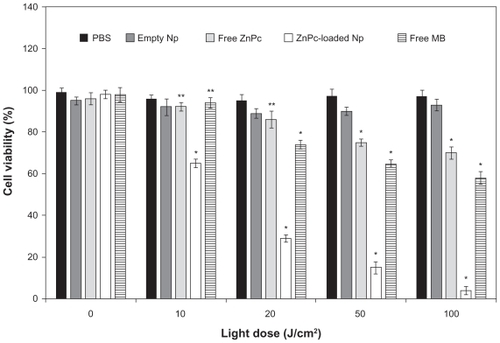
Figure 6 Morphological evaluation of the A549 cells using light microscope: A) and B) cells incubated with PBS (control). C) and D) cells incubated with empty nanoparticles suspension. E) and F) cells incubated with ZnPc-loaded nanoparticles. (A), (C), and (E) were observed at magnification of ×50 (scale 200 μm). (B), (I), and (F) were observed at magnification of ×400 (scale 50 μm).
Abbreviations: PBS, phosphate-buffered saline; ZnPc, zinc phthalocyanine.
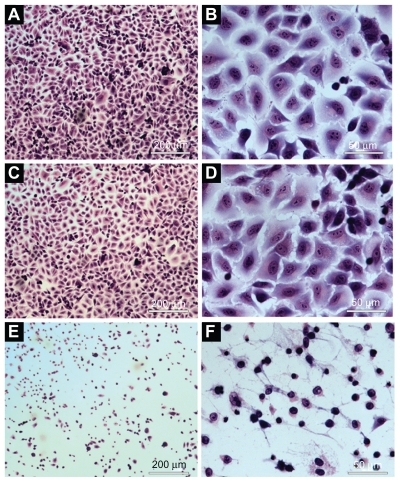
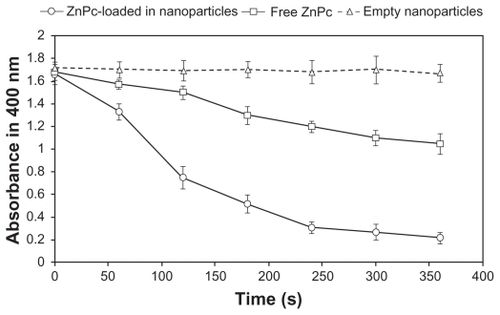
Figure 7 Photobleaching of ABMDMA by singlet oxygen generated by encapsulated ZnPc and free ZnPc. Empty nanoparticles were used as control. The change in ABMDMA absorption at 400 nm was measured as a function of the irradiation time. Each data point represents the mean (±SD) of n = 3 determinations.
Abbreviations: ABMDMA, 9,10-anthracenediyl-bis(methylene)dimalonic acid; ZnPc, zinc phthalocyanine; SD, standard deviation.