Figures & data
Figure 1 Fluorescence imaging of cells treated with QD625 or AHP-QD625.
Notes: PHB-expressing (A) and non-PHB expressing (B) cells were treated with QD625 or AHP-QD625 for 1 h; the images were captured using a fluorescence microscope. Scale bars, 10 μm. Blue, nuclei stain (DAPI) and red, QDs’ fluorescence.
Abbreviations: AHP, adipose homing peptide; DAPI, diamidino-2-phenylindole; PHB, prohibitin; QDs, quantum dots.
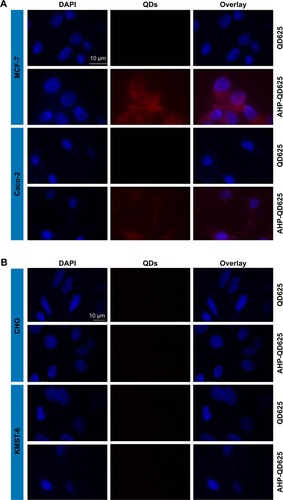
Figure 2 Cellular binding and uptake of QD625 and AHP-QD625 by microvascular ECs isolated from the WATs.
Notes: ECs isolated from Epi (A) and SQ (B) WATs of lean and obese rats were treated with QD625 and AHP-QD625 for 1 h at 37°C. Bar graphs show Cd as a percentage of the treatment dose present in each sample as determined by ICP-OES analysis. n=3; *statistically significant at P<0.05.
Abbreviations: AHP, adipose homing peptide; Cd, cadmium; ECs, endothelial cells; Epi, epididymal; HF, high fat; ICP-OES, inductively coupled plasma optical emission spectroscopy; LF, low fat; SQ, subcutaneous; QD, quantum dot; WATs, white adipose tissues.
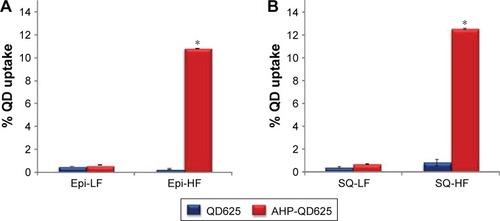
Figure 3 Body and tissue weights of LF-and HF-fed rats measured at termination.
Notes: ***Statistically significant at P<0.0001. Results are presented as mean ± SEM, n=20.
Abbreviations: Epi, epididymal; HF, high fat; LF, low fat; Mes, mesenteric; Peri, perirenal; Retro, retroperitoneal; SQ, subcutaneous.
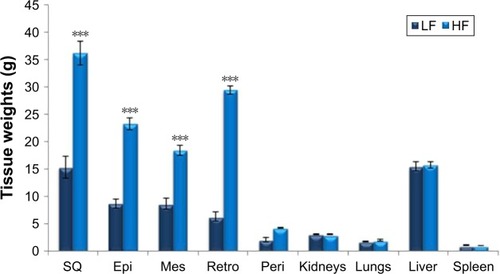
Figure 4 Fluorescent imaging and quantitative biodistribution of QDs in organs isolated from obese Wistar rats.
Notes: The rats were intravenously injected with PBS (untreated), QD625, and AHP-QD625. Fluorescence images of selected organs were acquired using IVIS® Lumina XR (A). Yellow color, QDs’ fluorescence. Bar graphs show Cd as a percentage of the injected dose present in each sample as determined by ICP-OES analysis (B). **Statistically significant at P<0.001; ***P<0.0001.
Abbreviations: AHP, adipose homing peptide; Cd, cadmium; Epi, epididymal; ICP-OES, inductively coupled plasma optical emission spectroscopy; Max, maximum; Min, minimum; PBS, phosphate-buffered saline; QD, quantum dot.
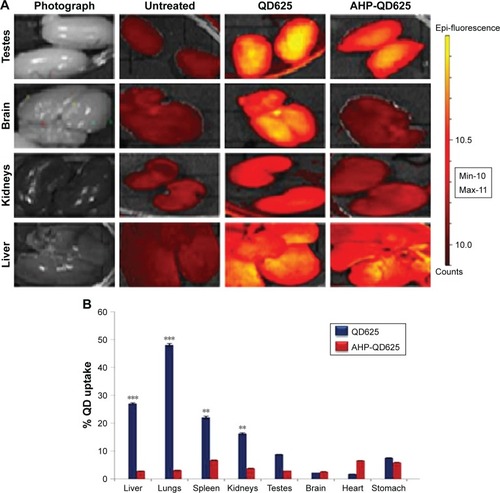
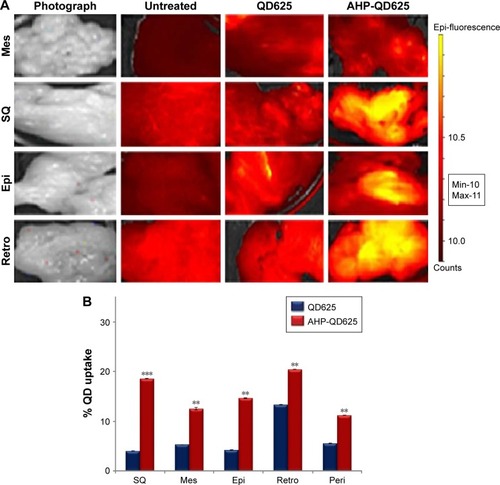
Figure 5 Fluorescent imaging and quantitative biodistribution of Cd-based QDs in WATs isolated from obese Wistar rats, 24 h postinjection.
Notes: The rats were intravenously injected with PBS (untreated), QD625, or AHP-QD625. Fluorescence images of selected organs were acquired using IVIS® Lumina XR (A). Yellow color = QDs’ fluorescence. Bar graphs show Cd as a percentage of the injected dose present in each sample as determined by ICP-OES analysis (B). n=3; **statistically significant at P<0.001; ***P<0.0001.
Abbreviations: AHP, adipose homing peptide; Cd, cadmium; Epi, epididymal; ICP-OES, inductively coupled plasma optical emission spectroscopy; Max, maximum; Mes, mesenteric; Min, minimum; PBS, phosphate-buffered saline; Peri, perirenal; QD, quantum dot; Retro, retroperitoneal; SQ, subcutaneous; WATs, white adipose tissues.