Figures & data
Figure 1 ThT-binding fluorescence of RADA16-I nanofibers. (A) TEM image of RADA16-I nanofibers without ThT. (B) TEM image of RADA16-I nanofibers with ThT. (C) Fluorescence spectrum of ThT-binding RADA16-I. (D) Change of fluorescence intensity at 495 nm at different time points after ThT-binding.
Abbreviations: AU, arbitrary units; TEM, transmission electron microscopy; ThT, Thioflavin-T.
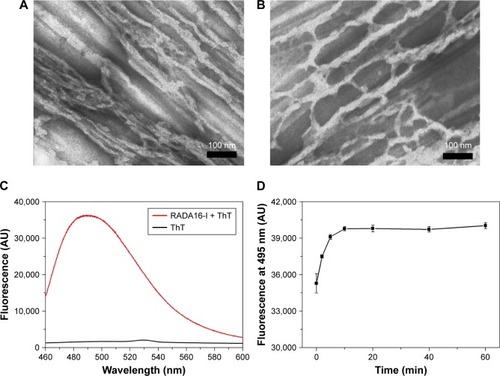
Figure 2 Effect of peptide concentration on thioflavin-T-binding fluorescence. (A) Fluorescence spectra at different peptide concentrations. (B) Fluorescence intensity at 495 nm indicated a critical aggregating concentration value (broken red arrow).
Abbreviation: AU, arbitrary units.
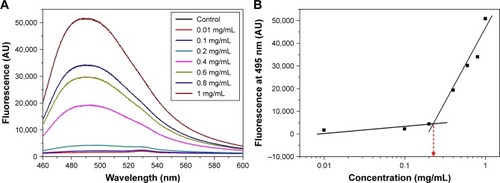
Figure 3 Thioflavin-T-binding fluorescence reveals the kinetic self-assembly, disassembly, and reassembly of RADA16-I. (A) Self-assembly kinetics of freshly prepared peptide solution. (B) Disassembly–reassembly process after ultrasound treatment.
Abbreviation: AU, arbitrary units.
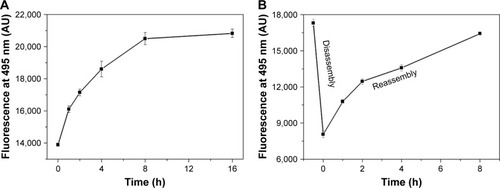
Figure 4 Effect of pH on self-assembly of RADA16-I. (A) Change of thioflavin-T-binding fluorescence of RADA16-I nanofibers incubated at different pH. (B) Circular dichroism spectra of RADA16-I at different pH. (C) Transmission electron microscopy images of nanostructures formed by RADA16-I at different pH.
Abbreviation: AU, arbitrary units.
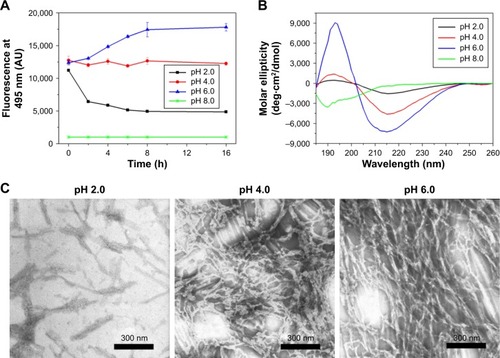
Figure 5 Microscope images of RADA16-I nanofibers based on amyloid-like staining properties. Thioflavin-T-binding nanofibers could be observed by fluorescent microscope (A, B). Congo red-stained nanofibers were sorrel under normal light and (C) apple-green under polarized light (D).
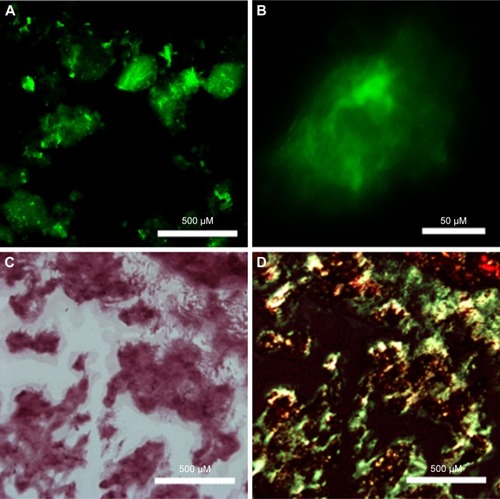
Figure 6 Fluorescent microscope images of RADA16-I nanofibers/hydrogel with pyrene (A) or Dox (B) embedded. Insets are photographs for a suspension with pyrene (A) and a hydrogel with Dox (B).
Abbreviations: Dox, doxorubicin hydrochloride; ThT, thioflavin-T.
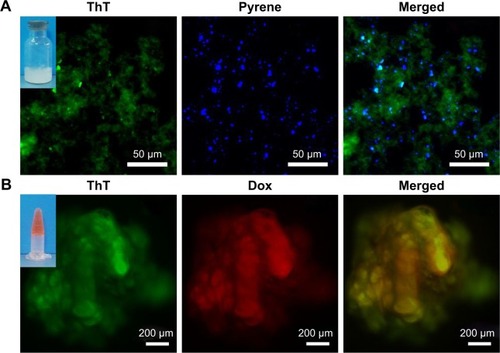
Figure 7 Fluorescent microscope images of PC12 cells embedded in RADA16 nanofiber scaffold. Arrows indicate cells beginning to stretch out and intrude into the surrounding scaffold.
Abbreviations: RhoB, Rhodamine B; ThT, thioflavin-T.
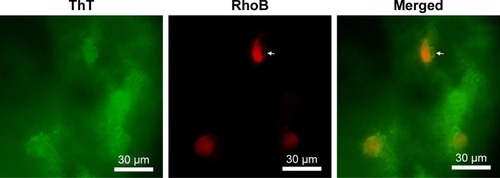
Figure 8 Congo red staining revealed distribution of RADA16-I nanofibers in vivo. Left: under normal light. Right: under polarized light.
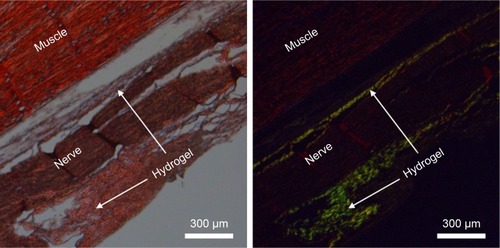
Figure S1 Thioflavin-T-binding fluorescence of RADA16-I dissolved in buffers with different pH. (A) Representative fluorescent spectra at different pH. (B) Comparison of fluorescence intensity at 495 nm.
Abbreviation: AU, arbitrary units.
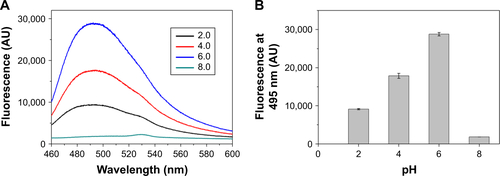
Figure S2 Thioflavin-T unspecifically stained nearly all kinds of tissue in the body. (A) White field. (B) Fluorescent field.
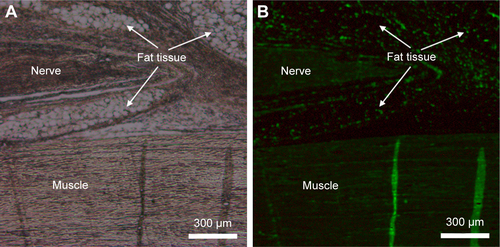
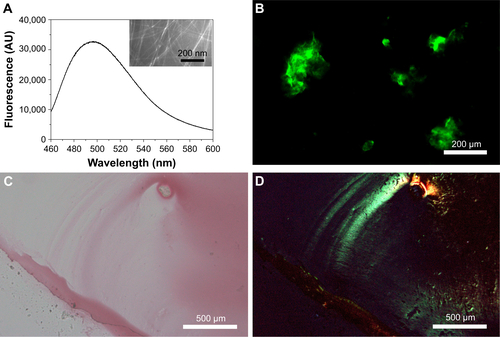
Figure S3 Amyloid-like staining properties of Q11 nanofibers. (A) ThT-binding fluorescence (insert shows transmission electron microscopy image of Q11 nanofibers). (B) Fluorescent image of Q11 nanofibers after ThT-binding. (C, D) Images of Q11 nanofibers after Congo red staining under normal light (C) or polarized light (D).
Abbreviations: AU, arbitrary units; ThT, thioflavin-T.