Figures & data
Figure 1 ID93 remaining in solution after centrifugation subsequent to mixing with the 20 mM citrate-phosphate buffer at the indicated pH with (filled bars) or without (open bars) the addition of NaCl to increase the ionic strength to I = 0.15. Results shown are from a single experiment.
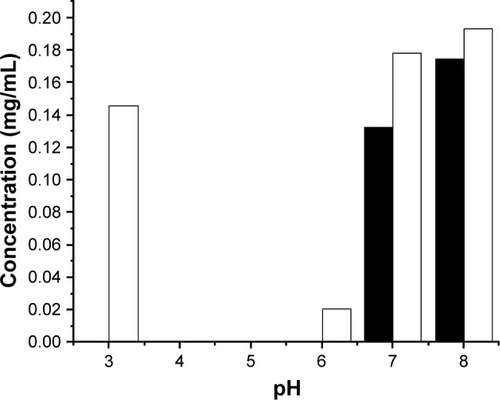
Figure 2 Physicochemical data collected for ID93 as a function of temperature (10°C–90°C) and pH (6.5–8.5). Secondary structure of ID93 was assessed by CD at 10°C from 200 to 250 nm (A) and monitored at 208 nm as a function of temperature (B). Tertiary structure of ID93 was assessed by intrinsic fluorescence, and the emission spectra were collected from 305 to 405 nm after excitation at 295 nm. Normalized fluorescence emission spectra are shown at 10°C (C), and the mean spectral mass was determined at each temperature (D). Aggregation of ID93 was monitored by static light scattering (E) and OD350 nm measurements (F). Data are shown for pH 6.5–8.5 (filled squares, open circles, filled triangles, open triangles, and filled diamonds 0.5 pH increments, respectively). Data were collected in duplicate, and error bars represent the standard deviation of those measurements.
Abbreviations: CD, circular dichroism; MSM, mean spectral mass.
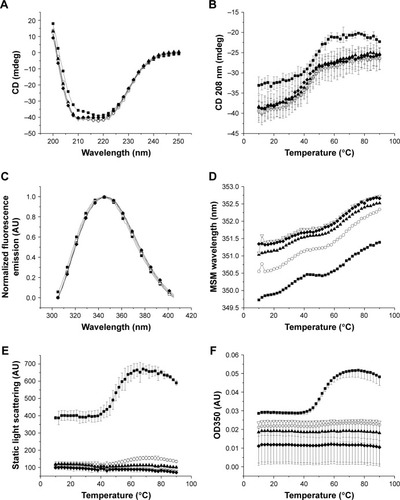
Figure 3 An EPD of ID93 using the physicochemical data from . At least five distinct phases are evident.
Abbreviation: EPD, empirical phase diagram.
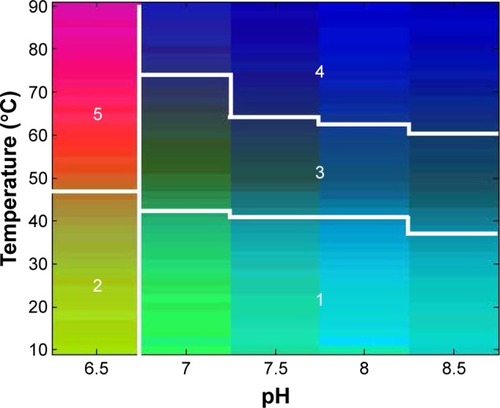
Table 1 Maximum OD350 nm and Z-average particle size from the ID93 excipient screen and GLA-SE excipient compatibility studies
Figure 4 Aggregation of ID93 as a function of temperature. Excipients are grouped as detergents (A), amino acids (B), charged compounds (C), sugars and sugar alcohols (D), and other (E). ID93 is shown as a bold curve in each figure for comparison. Data were used to calculate the maximum OD350 values used in and .
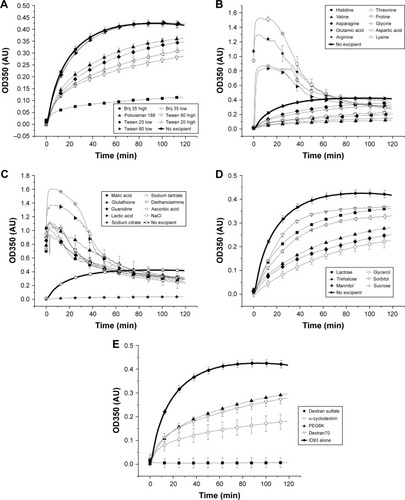
Figure 5 Percent turbidity inhibition of ID93 by the indicated excipient in 20 mM Tris pH 7.0 buffer. provides the excipient concentrations. Percent turbidity inhibition is calculated from 1 minus the ratio of maximum OD350 of ID93 with excipient and the maximum OD350 of ID93 alone, and converting to percent.
Abbreviation: PEG, polyethylene glycol.
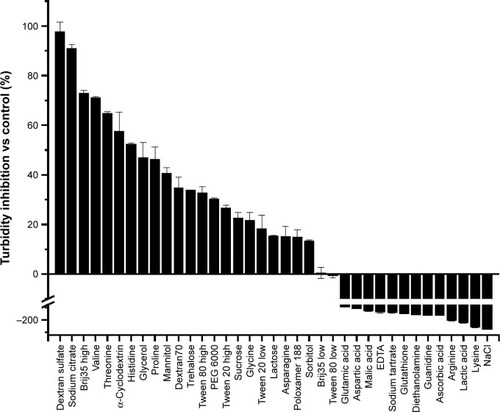
Table 2 Factors used in DoE construction
Figure 6 pH of samples from DoE1 measured after formulation, lyophilization and reconstitution, and after heat stress. Samples are arranged by buffer type and pH including Tris pH 7.5 (A), Tris pH 8.0 (B), phosphate pH 7.5 (C), and phosphate pH 8.0 (D). The largest changes in pH are seen for Tris buffer after lyophilization, whereas smaller changes are seen for phosphate buffers (see Table S2).
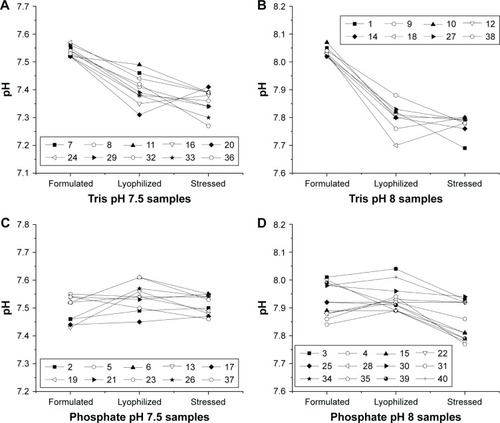
Figure 7 Z-average diameters measured by DLS for lyophilized and reconstituted samples from DoE1 (A), DoE2 (B), and DoE3 (C). Particle size measured after lyophilization and reconstitution. Trends between disaccharide type for DoE1 and glycine concentration for DoE2 are apparent. See Tables S2–S4 for sample compositions.
Abbreviations: DLS, dynamic light scattering; DoE, design of experiments.
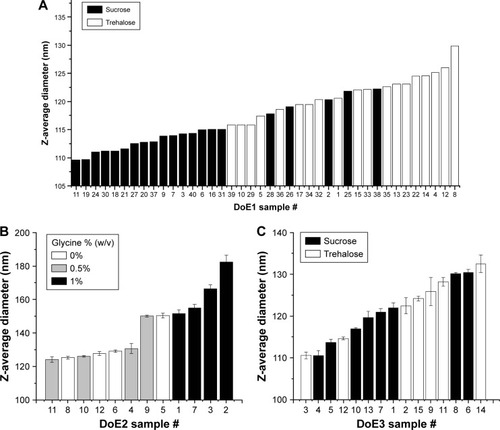
Figure 8 Z-average diameters measured by DLS for heat-stressed samples from DoE1 (A), DoE2 (B), and DoE3 (C). Sucrose–mannitol samples displayed the smallest particle size for DoE1. Particle size for DOE2 increased dramatically for all samples. Particle size increased for glycine-containing samples in DoE3. See Tables S2–S4 for sample compositions.
Abbreviations: DLS, dynamic light scattering; DoE, design of experiments.
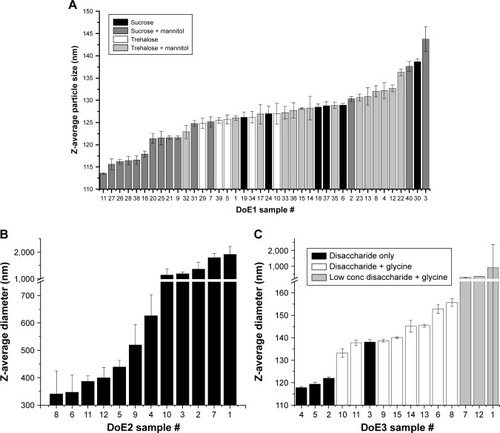
Figure 9 Z-average diameters measured by DLS for samples from the additive study after lyophilization (A) and heat stress (B). Sodium citrate decreased particle size for the glycine–mannitol formulation after lyophilization, but no benefit was seen for either sodium citrate or Tween 80 in other samples. See Table S5 for sample compositions.
Abbreviation: DLS, dynamic light scattering.
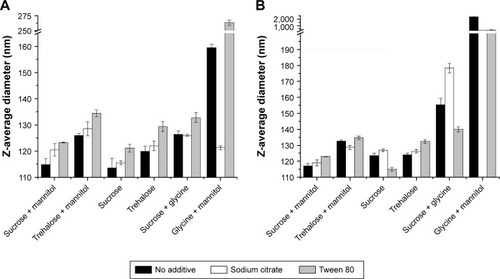
Figure 10 Examples of lyophilized cakes after lyophilization (A) characterized as poor (first column), acceptable (second column), or excellent (third column). Specific classification criteria are listed in the “Materials and methods” section. Examples of changes observed in lyophilized cakes after heat stress (B). The paired vial images indicate sample appearance before (left vial) or after (right vial) heat stress. Examples of major (top row), minor (middle row), and no change (bottom row) are shown. See Tables S2–S5 for sample compositions.
Abbreviation: DoE, design of experiments.
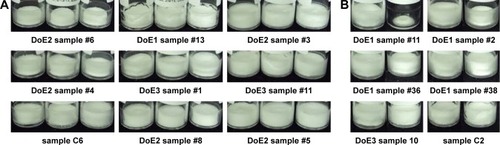
Table 3 Optimized formulations and predicted responses, DoE1
Figure 11 Z-average diameter (A), pH measurements (B), GLA content (C), and ID93 content (D) for samples stored for 3 months at the indicated temperatures. The six lead formulations (TP, TT, TMP, SMP, SP, and ST), the POC formulation, two-vial clinical presentation, and a liquid single-vial comparator are shown. Error bars indicate the standard deviation of two (D) or three (A and C) measurements.
Abbreviations: GLA, glucopyranosyl lipid adjuvant; TP, trehalose–phosphate; TT, trehalose–Tris; TMP, trehalose–mannitol–phosphate; SMP, sucrose–mannitol–phosphate; SP, sucrose–phosphate; ST, sucrose–Tris; POC, proof of concept.
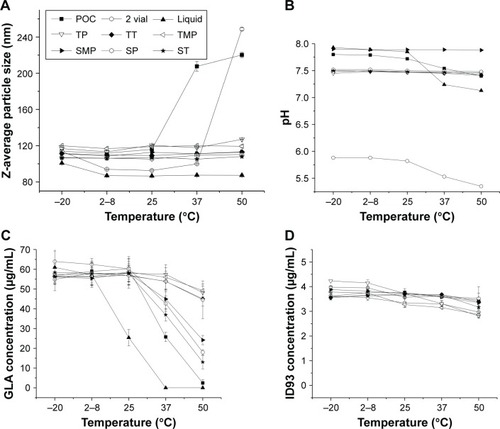
Table 4 Stability comparison of lead lyophilized formulations vs POC samples after storage at 37°C for 3 months
Figure 12 Cellular and antibody responses in mice immunized with control liquid formulations and the reconstituted lead lyophilized formulations. (A) CD4+ T cells collected from splenocytes 4 weeks after boost immunization were stimulated with ID93 and assessed for intracellular CD154 and IFN-γ production. (B) Serum antibody isotypes IgG1 and IgG2c were measured from sera collected 4 weeks following boost immunization. Data represent ten mice pooled from two independent experiments with five mice per experiment. Graphs show mean values ± SEM for each group. Statistics by two-way ANOVA with Dunnett’s correction for multiple comparison test relative to the control liquid two vial with no excipient and one-way ANOVA with Sidak’s correction for multiple comparison test within liquid and lyophilized pairs; *P < 0.05; **P < 0.01.
Abbreviations: POC, proof of concept; TP, trehalose–phosphate; TT, trehalose–Tris; TMP, trehalose–mannitol–phosphate; SMP, sucrose–mannitol–phosphate; SP, sucrose–phosphate; ST, sucrose–Tris.
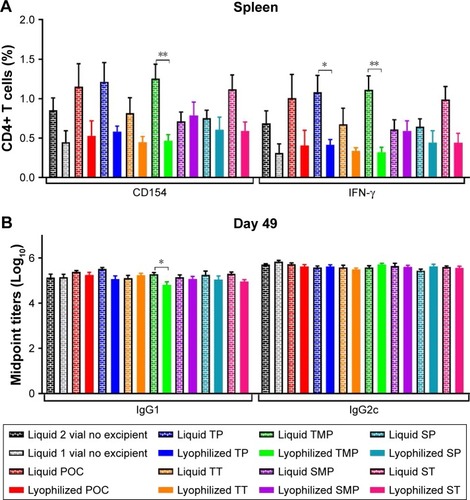
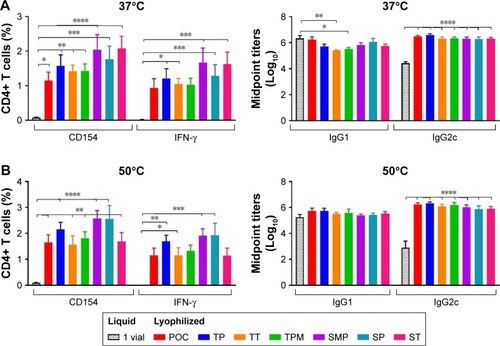
Figure 13 Cellular and antibody responses in mice immunized with formulations stored 3 months at 37°C (A) or 50°C (B). CD4+ T cells collected from splenocytes 4 weeks after boost immunization were stimulated with ID93 and assessed for CD154 and IFN-γ production (left panels). Serum antibody isotypes IgG1 and IgG2c were measured from sera collected 4 weeks following boost immunization (right panels). Data represent ten mice pooled from two independent experiments with five mice per experiment. Graphs show mean values ± SEM for each group. Statistics by two-way ANOVA with Dunnett’s correction for multiple comparison test relative to the control liquid single vial with no excipient; *P < 0.05; **P < 0.01; ***P < 0.001; ****P < 0.0001.
Abbreviations: POC, proof of concept; TP, trehalose–phosphate; TT, trehalose–Tris; TMP, trehalose–mannitol–phosphate; SMP, sucrose–mannitol–phosphate; SP, sucrose–phosphate; ST, sucrose–Tris.