
Figures & data
Table 1 Keratin–PTX ratio for nanoparticles’ synthesis
Figure 1 KER-NPs-PTX preparation.
Notes: (A) KER-NPs-PTX preparation by aggregation method, starting from a solution of pure keratin powder. (B) Correlation between PTX loading and KER-NPs-PTX size.
Abbreviations: KER-NPs-PTX, PTX loaded in keratin nanoparticles; PDI, polydispersity index; PTX, paclitaxel; RT, room temperature.
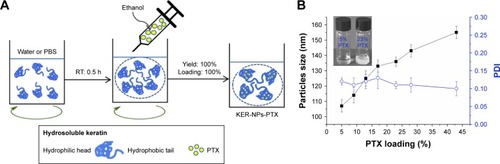
Figure 2 KER-NPs-PTX analysis.
Notes: Transmission electron microscopy images of fixed KER-NPs-PTX at two magnifications: scale bar 2 µm (A) and scale bar 200 nm (B). Morphological analysis showed particles spherical in shape, smooth surface, and an average dry diameter of ~80 nm. Stability of KER-NPs-PTX in physiological conditions (C). Fluorescence spectra of KER-NPs-PTX at different PTX loading percentages (D).
Abbreviations: KER-NPs-PTX, PTX loaded in keratin nanoparticles; PDI, polydispersity index; PTX, paclitaxel.
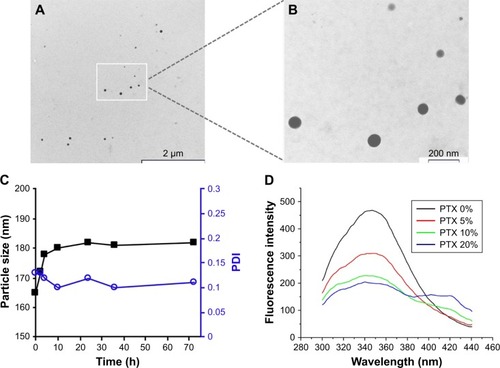
Figure 3 Profiles and mechanisms of PTX release from KER-NPs in vitro.
Notes: Profile of PTX release from KER-NPs (A). Correlation coefficient values (R2) used to determine the best fitting model among zero-order, first-order, and Higuchi modes (B).
Abbreviations: KER-NPs, keratin nanoparticles; PTX, paclitaxel.
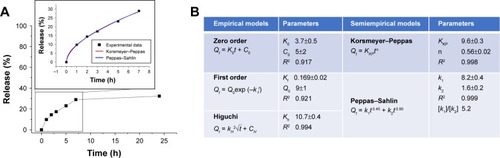
Figure 4 Antiproliferative activity of PTX in a free form, HSA-NPs-PTX, and KER-NPs-PTX on MCF-7 and MDA MB 231 cell lines in 2D model.
Notes: Cell viability was evaluated 72 h after exposure to increasing concentrations of PTX (0.00002, 0.02, and 5 µg/mL) by APH assay. Statistical significance versus untreated cells (100%, represented by a dotted line): **P<0.01 and ***P<0.001. Statistical significance of data related to cells treated with KER-NPs-PTX versus cells treated with HSA-NPs-PTX: °P<0.05 and °°P<0.01.
Abbreviations: APH, acid phosphatase; 2D, two-dimensional; HSA-NPs-PTX, PTX loaded in albumin nanoparticles; KER-NPs-PTX, PTX loaded in keratin nanoparticles; PTX, paclitaxel.
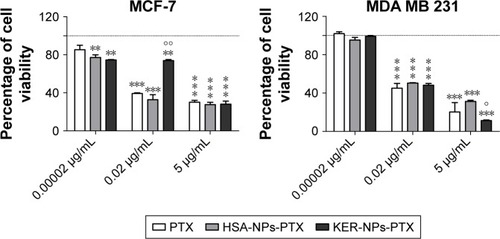
Figure 5 Induction of apoptosis in tumor cells cultured in 2D by PTX in a free form, HSA-NPs-PTX, or KER-NPs-PTX in 2D model.
Notes: MCF-7 and MDA MB 231 cells were exposed to PTX, HSA-NPs-PTX, and KER-NPs-PTX (PTX, 5 µg/mL) for 24 and 48 h. Apoptosis assays were carried out by flow cytometry, following APC-Annexin V and PI staining. Representative dot plots of MCF-7 (A) and MDA MB 231 (B) cell lines after each treatment. Percentage of early apoptotic cells (positive to APC-Annexin V and negative to PI) and late apoptotic cells (positive to APC-Annexin V and PI) was evaluated 24 and 48 h after treatment (C). Statistical significance versus untreated cells: *P<0.05, **P<0.01, and ***P<0.001. Statistical significance of data related to cells treated with KER-NPs-PTX versus cells treated with HSA-NPs-PTX: °°P<0.01.
Abbreviations: 2D, two-dimensional; HSA-NPs-PTX, PTX loaded in albumin nanoparticles; KER-NPs-PTX, PTX loaded in keratin nanoparticles; PI, propidium iodide; PTX, paclitaxel.
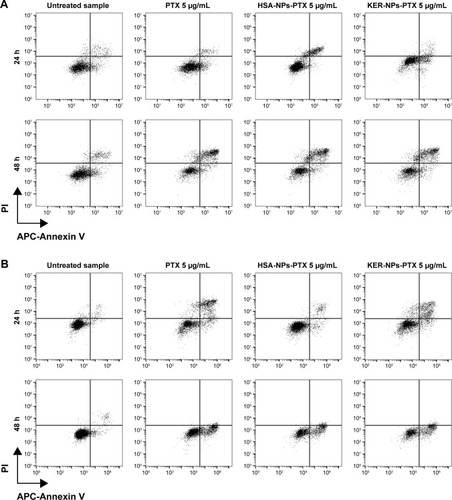
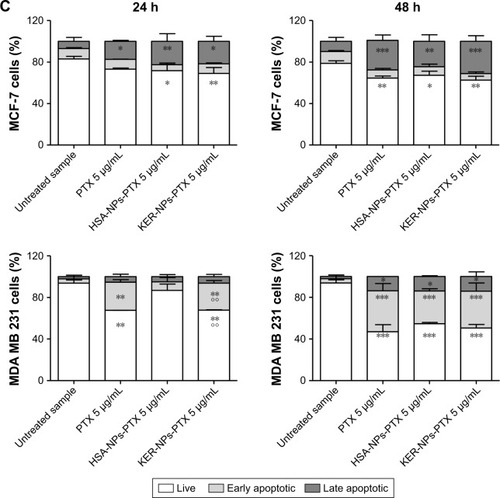
Figure 6 BAX and BCL-2 gene expression analyses in MCF-7 and MDA MB 231 cells cultured in 2D model upon 12 h treatment.
Notes: Cells were incubated for 12 h with PTX in a free form, HSA-NPs-PTX, or KER-NPs-PTX (PTX, 5 µg/mL). GAPDH was used as reference gene to normalize data. Effects of each treatment on gene expression levels were compared with those detectable in untreated cells (n=1) as indicated by the dotted line. Statistically significant difference versus untreated cells: *P<0.05.
Abbreviations: 2D, two-dimensional; GAPDH, glyceraldehyde-3-phosphate dehydrogenase; HSA-NPs-PTX, PTX loaded in albumin nanoparticles; KER-NPs-PTX, PTX loaded in keratin nanoparticles; PTX, paclitaxel.
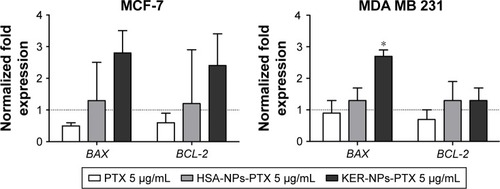
Figure 7 Representative H&E staining of scaffold sections from p3D MCF-7 and MDA MB 231 cultures after treatments.
Notes: MCF-7 (upper panels) and MDA MB 231 (lower panels) cells were initially cultured for 7 and 4 days, respectively, and then left untreated (A) or treated for 48 h with PTX in a free form (B), HSA-NPs-PTX (C), and KER-NPs-PTX (D) (PTX, 5 µg/mL). Scale bar: 100 µm.
Abbreviations: H&E, hematoxylin and eosin; HSA-NPs-PTX, PTX loaded in albumin nanoparticles; KER-NPs-PTX, PTX loaded in keratin nanoparticles; p3D, three-dimensional model with perfused bioreactor; PTX, paclitaxel.
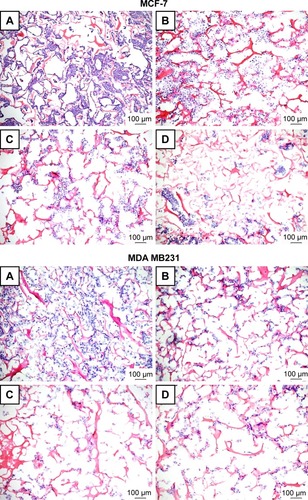
Figure 8 Effects of PTX in a free form or vehiculated by HSA-NPs or by KER-NPs on cell death in p3D cultures.
Notes: MCF-7 and MDA MB 231 cells were exposed to PTX in a free form, HSA-NPs-PTX, and KER-NPs-PTX (PTX, 5 µg/mL) for 24 and 48 h. Apoptosis assays were carried out by flow cytometry, following APC-Annexin V and PI staining. Representative dot plots of MCF-7 (A) and MDA MB 231 (B) cell lines after each treatment. Percentages of early apoptotic cells (positive to APC-Annexin V and negative to PI) and late apoptotic cells (positive to APC-Annexin V and PI) were evaluated 24 and 48 h after treatment (C). Statistical significance versus untreated cells: *P<0.05.
Abbreviations: HSA-NPs, albumin nanoparticles; HSA-NPs-PTX, PTX loaded in HSA-NPs; KER-NPs, keratin nanoparticles; KER-NPs-PTX, PTX loaded in KER-NPs; p3D, three-dimensional model with perfused bioreactor; PI, propidium iodide; PTX, paclitaxel.
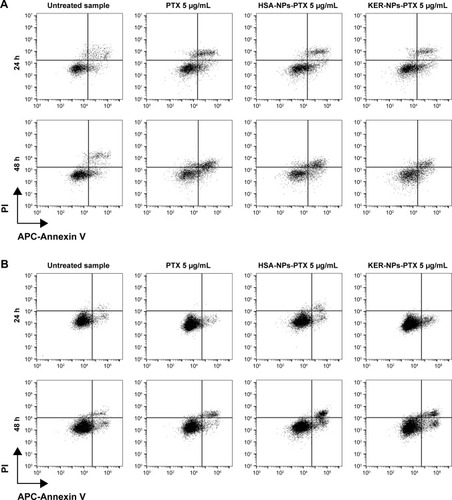
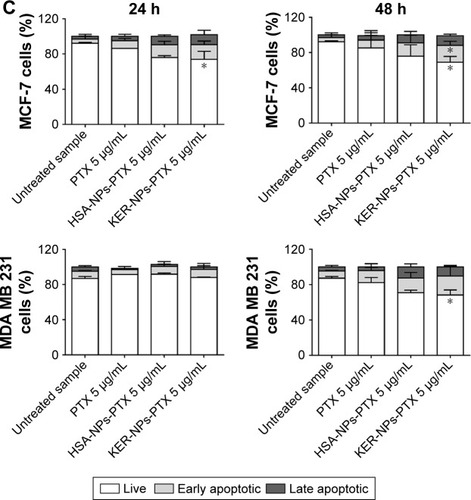
Figure 9 Immunofluorescence staining of CC3 in MCF-7 (upper panels) and MDA MB 231 (lower panels) scaffold sections.
Notes: Images show DAPI (blue) and CC3 (green) staining in MCF-7 (A) and MDA MB 231 (B) p3D scaffold sections upon treatment with PTX in a free form (b), HSA-NPs-PTX (c), and KER-NPs-PTX (d) (PTX, 5 µg/mL) for 48 h or untreated (a). Scale bar: 100 µm.
Abbreviations: CC3, cleaved caspase 3; DAPI, 4′,6-diamidino-2-phenylindole; HSA-NPs-PTX, PTX loaded in albumin nanoparticles; KER-NPs-PTX, PTX loaded in keratin nanoparticles; p3D, three-dimensional model with perfused bioreactor; PTX, paclitaxel.
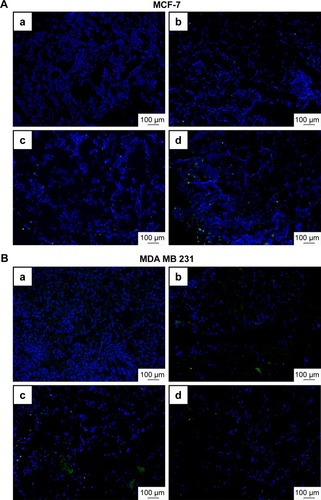
Figure 10 BAX and BCL-2 gene expression analyses in MCF-7 and MDA MB 231 cells in p3D cultures following 24 h treatments.
Notes: Cells were incubated for 24 h with PTX in a free form, HSA-NPs-PTX, or KER-NPs-PTX (PTX, 5 µg/mL). GAPDH was used as reference gene to normalize data. The effects of each treatment were compared with gene expression detectable in untreated cells (=1) as indicated by the dotted line. Statistically significant difference versus untreated cells: *P<0.05.
Abbreviations: GAPDH, glyceraldehyde-3-phosphate dehydrogenase; HSA-NPs-PTX, PTX loaded in albumin nanoparticles; KER-NPs-PTX, PTX loaded in keratin nanoparticles; p3D, three-dimensional model with perfused bioreactor; PTX, paclitaxel.
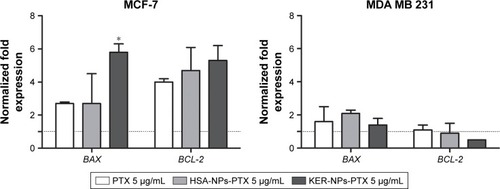
Figure S1 Profile of PTX release from HSA-NPs.
Abbreviations: HSA-NPs, albumin nanoparticles; PTX, paclitaxel.
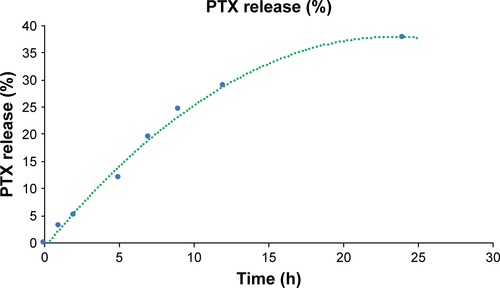
Figure S2 Transmission electron microscopy images of unfixed KER-NPs-PTX at two magnifications.
Notes: Morphological analysis shows that the particles had smooth surface, spherical shape with a central core surrounded by a weak halo, and an average dry diameter of ~100 nm. (A) Particles with scale bar of 2 µm; (B) particles with a scale bar of 200 nm.
Abbreviation: KER-NPs-PTX, paclitaxel loaded in keratin nanoparticles.
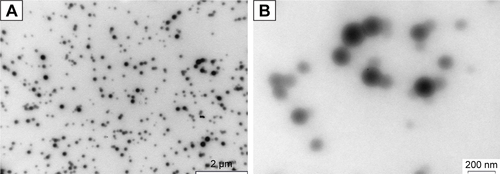
Figure S3 Stability of KER-NPs-PTX in PBS at 37°C measured by DLS analysis.
Abbreviations: DLS, dynamic light scattering; KER-NPs-PTX, paclitaxel loaded in keratin nanoparticles; PDI, polydispersity index.
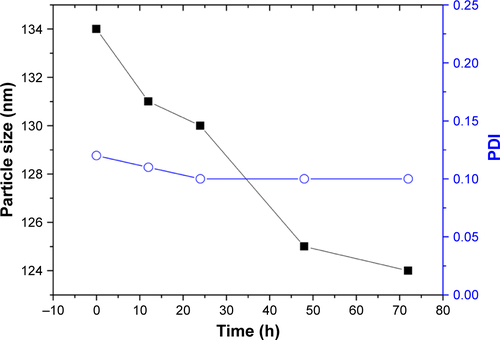
Figure S4 Evaluation of cytotoxic activity of HSA-NPs and KER-NPs on MCF-7 and MDA MB 231 cell proliferation in 2D model.
Notes: Cell proliferation was evaluated 72 h after exposure to increasing concentrations of HSA-NPs (0.0002, 0.22, and 55 µg/mL equivalent to PTX concentration of 0.00002, 0.02, and 5 µg/mL, respectively) or of KER-NPs (0.00004, 0.04, and 10 µg/mL equivalent to PTX concentration of 0.00002, 0.02, and 5 µg/mL, respectively) by APH assay. Untreated cells (100% are represented by a dotted line). PTX-F35 in a free form or as HSA-NPs-PTX-F35 or KER-NPs-PTX-F35 cytofluorimetric cellular uptake.
Abbreviations: APH, acid phosphatase; 2D, two-dimensional; HSA-NPs, albumin nanoparticles; HSA-NPs-PTX-F35, PTX labeled with a thiophene-based fluorescent dye and loaded in HSA-NPs; KER-NPs, keratin nanoparticles; KER-NPs-PTX-F35, PTX labeled with a thiophene-based fluorescent dye and loaded in KER-NPs; PTX, paclitaxel; PTX-F35, PTX labeled with a thiophene-based fluorescent dye.
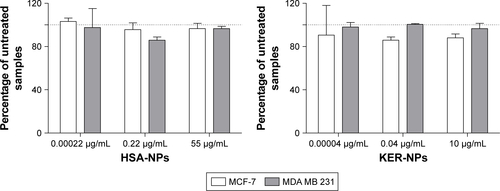
Figure S5 Paclitaxel labelled with a thiophene-based fluorescent dye (PTX-F35).
Notes: (A) Molecular structure of PTX-F35. (B) Absorbance and emission spectra of PTX-F35.
Abbreviation: PTX-F35, paclitaxel labeled with a thiophene-based fluorescent dye.
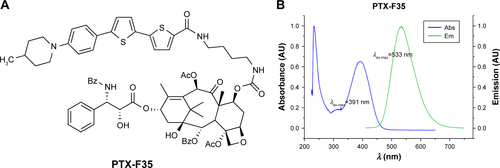
Figure S6 Cytofluorimetric analysis of the uptake of fluorescent PTX-F35 loaded in KER-NPs by MCF-7 and MDA MB 231 cells.
Notes: MCF-7 and MDA MB 231 cells were incubated at the same concentration of PTX-F35 ([PTX] =5 µg/mL) and KER-NPs-PTX-F35 for 2, 4, 6, and 24 h. Fluorescent signal was detected by a flow cytometer using a 488 nm excitation to measure intracellular PTX-F35 and expressed as iMFI ratio. Statistical significance versus untreated cells: *P<0.05 and ***P<0.001.
Abbreviations: iMFI, integrated median fluorescence intensity; KER-NPs, keratin nanoparticles; KER-NPs-PTX-F35, PTX labeled with a thiophene-based fluorescent dye and loaded in KER-NPs; PTX, paclitaxel; PTX-F35, PTX labeled with a thiophene-based fluorescent dye.
![Figure S6 Cytofluorimetric analysis of the uptake of fluorescent PTX-F35 loaded in KER-NPs by MCF-7 and MDA MB 231 cells.Notes: MCF-7 and MDA MB 231 cells were incubated at the same concentration of PTX-F35 ([PTX] =5 µg/mL) and KER-NPs-PTX-F35 for 2, 4, 6, and 24 h. Fluorescent signal was detected by a flow cytometer using a 488 nm excitation to measure intracellular PTX-F35 and expressed as iMFI ratio. Statistical significance versus untreated cells: *P<0.05 and ***P<0.001.Abbreviations: iMFI, integrated median fluorescence intensity; KER-NPs, keratin nanoparticles; KER-NPs-PTX-F35, PTX labeled with a thiophene-based fluorescent dye and loaded in KER-NPs; PTX, paclitaxel; PTX-F35, PTX labeled with a thiophene-based fluorescent dye.](/cms/asset/1606dbb6-0266-4463-bbde-7c025ee1d327/dijn_a_159942_sf0006_b.jpg)
Table S1 HSA-NPs-PTX hydrodynamic diameters
Table S2 HSA-NPs-PTX zeta potential
Table S3 KER-NPs-PTX hydrodynamic diameters
Table S4 KER-NPs-PTX zeta potential