Figures & data
Figure 1 Creation of hierarchical rough zirconia with meso-, micro-, and nano-scale morphology.
Notes: (A) Scanning electron microscopic (SEM) images of machined zirconia and laser-engraved hierarchically roughened zirconia. The dotted lines within SEM images represent valley- or pit-like structures at the micron-scale. (B) Quantitative topographical evaluations (histograms) of the two zirconia surfaces. **p<0.01, statistically significant.
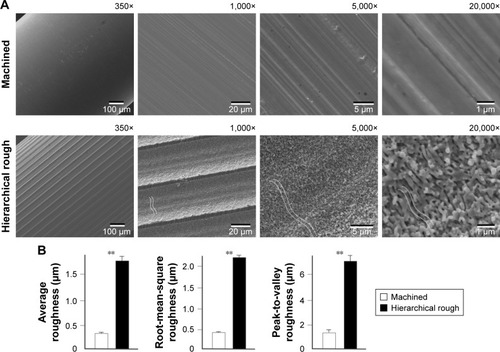
Figure 2 Three-dimensional profiles of the hierarchical rough zirconia surface.
Notes: (A–C) Three-dimensional images of the hierarchical rough zirconia surface taken with an optical profile microscope at three different magnifications. (D–G) Profile curves of the hierarchical rough zirconia surface by line scanning. Long (D, E) and short (F, G) line scanning were performed. Different filter values (cutoff value λc) were applied to draw each of the profile curves. Appearance of distinct structures at the meso-, micro-, and nano-scales are denoted within the profile curves.
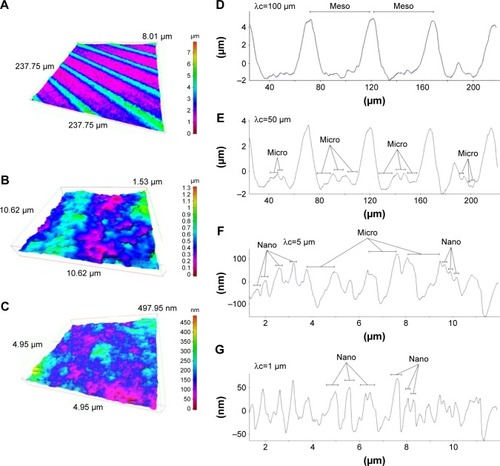
Figure 3 Three-dimensional profiles of the machined zirconia surface.
Notes: (A–C) Three-dimensional images of the machined zirconia surface taken with an optical profile microscope at three different magnifications. (D–G) Profile curves of the machined zirconia surface by line scanning. Long (D, E) and short (F, G) line scanning were performed. Different filter values (cutoff value λc) were applied to draw each of the profile curves.
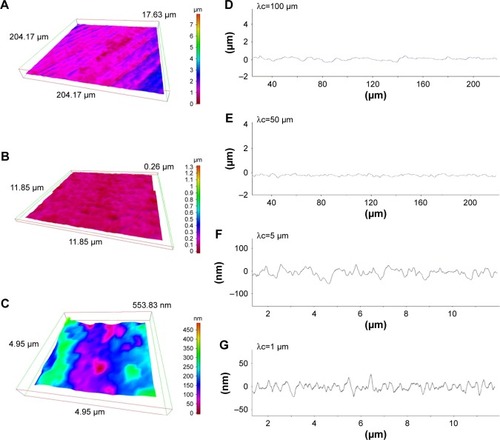
Figure 4 Chemical analysis of (A) machined zirconia and (B) hierarchical rough zirconia surfaces using x-ray photoelectron spectroscopy (XPS).
Abbreviation: CPS, counts per second.
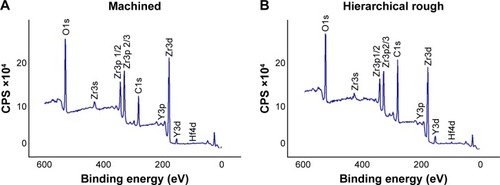
Figure 5 Hydrophilic or hydrophobic state of zirconia surfaces.
Notes: Side-view images of 10 µL double-distilled H2O placed on zirconia disks along with the measured contact angle. **p<0.01, statistically significant difference between the two surfaces.
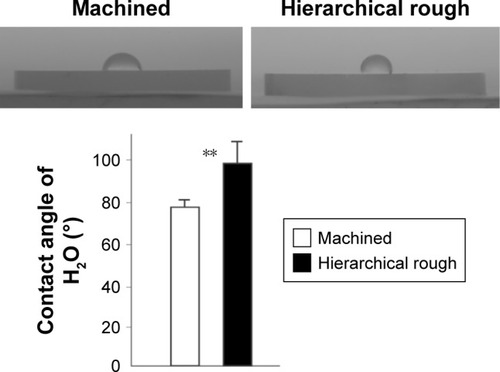
Figure 6 Attachment of osteoblasts to zirconia surfaces during the initial stage of culture.
Notes: Osteoblasts were cultured on machined and hierarchical rough zirconia surfaces. (A) The number of attached cells after 6 and 24 h incubations evaluated by the WST-1 assay. (B) Confocal microscopic images of osteoblast cultures on zirconia surfaces. NS, no statistically significant difference between the two different surfaces.
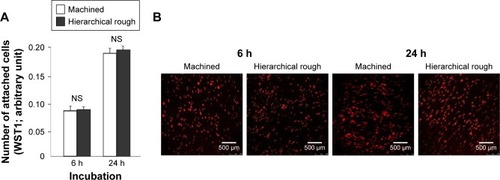
Figure 7 Spreading behavior of osteoblasts on zirconia surfaces during the initial stage of culture at 6 and 24 h after seeding.
Notes: (A) Confocal microscopic images of osteoblasts with immunochemical staining for cytoskeletal actin. (B) Histograms for cytomorphometric parameters measured from the images. *p<0.05, statistically significant difference between the two surfaces. NS, no statistically significant difference between the two different surfaces.
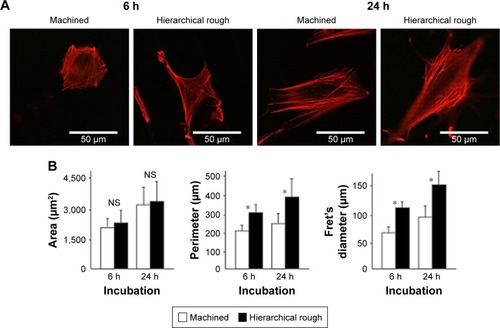
Figure 8 Proliferative activity of osteoblasts on zirconia surfaces.
Notes: (A) Cell density of the propagated cells evaluated on day 3 of culture using the WST-1 assay. (B) BrdU incorporation into DNA measured on day 3. NS, no statistically significant difference between the two different surfaces.
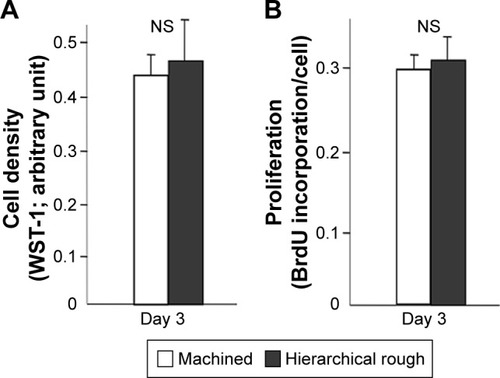
Figure 9 Functional osteoblastic differentiation on zirconia surfaces.
Notes: (A) Alkaline phosphatase (ALP) activity in osteoblasts on day 5 of culture. Culture images after ALP staining (top images) and ALP positive area (%) measured using those images are presented. (B) Results from the real-time quantitative PCR performed on days 7 and 14. *p<0.05, **p<0.01, statistically significant difference between the two surfaces.
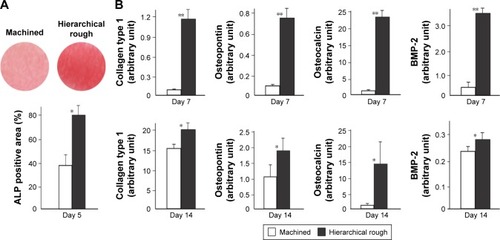
Figure 10 The strength of osseointegration evaluated by the biomechanical push-in test in the rat femur model.
Notes: *p<0.05; statistically significant difference between the two surfaces.
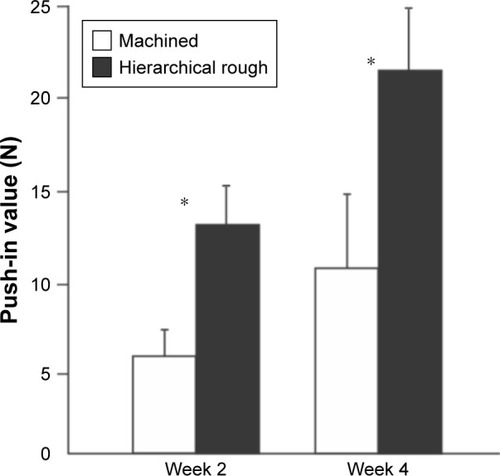
Figure 11 Peri-implant tissue morphology and chemistry around zirconia implants.
Notes: Zirconia implants with two different surfaces were retrieved after the biomechanical push-in test and analyzed by SEM and EDX. Low- and high-magnification SEM images are presented representing each of the machined (A–C) and hierarchical rough (E–G) zirconia implants. The percentage chemical composition from the EDX is presented along with the representative SEM magnified images (B, C, F, G). EDX area scans were also performed to detect Ca element as a bone ingredient (D, H).
Abbreviations: EDX, energy dispersive X-ray spectroscopy; SEM, scanning electron microscope.
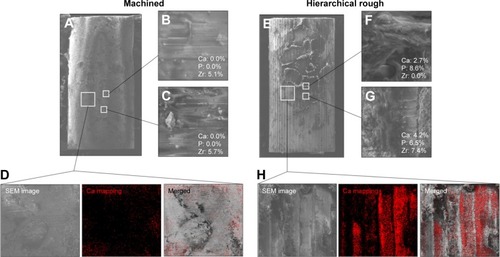
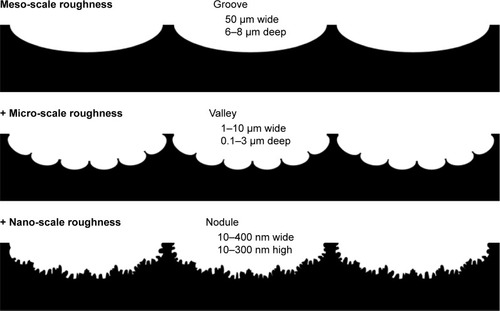
Figure 12 Schematic of the surface configuration of hierarchical rough zirconia based on the SEM analysis () and 3-dimensional profiling ().
Notes: The hierarchical rough zirconia was characterized by distinct grooves, valleys, and nodules at different structural levels at the meso-, micro-, and nano-scales, respectively, as illustrated sequentially from top to bottom.