Figures & data
Figure 1 Scanning electron microscopy.
Notes: (A) Raw date pits; (B and C) date-pit activated carbon; (D–F) jojoba-seed activated carbon; and (G–I) microalgae activated carbon.
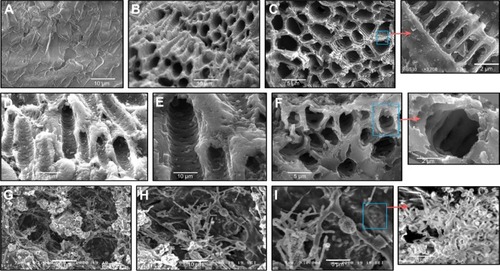
Table 1 Elemental analyses of AC produced from different phytomaterials
Figure 2 Fourier-transform infrared spectra.
Notes: (A) Date-pit activated carbon (AC); (B) microalgae activated carbon; and (C) jojoba-seed activated carbon.
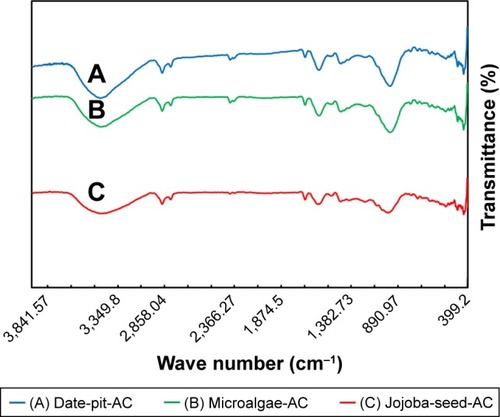
Figure 3 Size-distribution histograms of nanomaterial.
Notes: (A) Date-pit activated carbon, (B) jojoba-seed activated carbon, and (C) microalgae activated carbon dispersed in H2O.
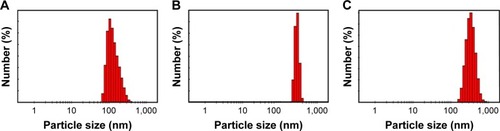
Figure 4 ζ-Potentials of (A) date-pit activated carbon, (B) jojoba-seed activated carbon, and (C) microalgae activated carbon nanomaterial dispersed in H2O.
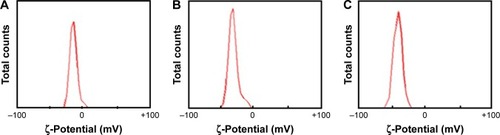
Figure 5 (A) TGA and (B) DSC curves for the raw phytomaterials date pits, jojoba, and microalgae.
Abbreviations: TGA, thermogravimetric analysis; DSC, differential scanning calorimetry.
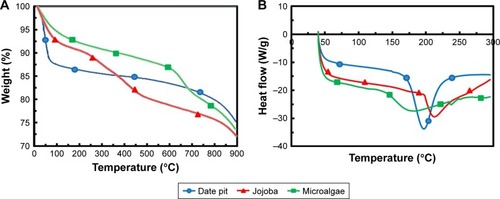
Figure 6 Time dependence of bilirubin and albumin remaining in solution.
Notes: Different concentrations of (A and B) date-pit AC, (C and D) jojoba-seed AC, and (E and F) microalgae AC.
Abbreviation: AC, activated carbon.
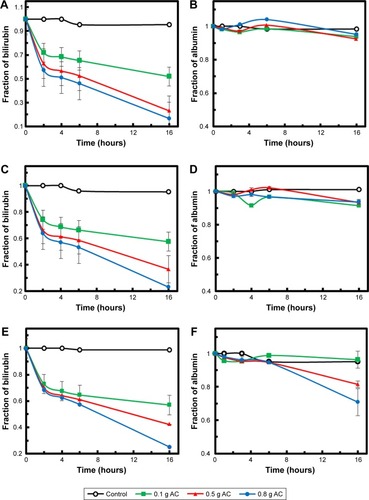
Figure 7 Effect of initial bilirubin concentration on final equilibrium concentration using 0.8 g date-pit AC, jojoba-seed AC, and microalgae AC at 37°C and pH 7.4.
Abbreviation: AC, activated carbon.
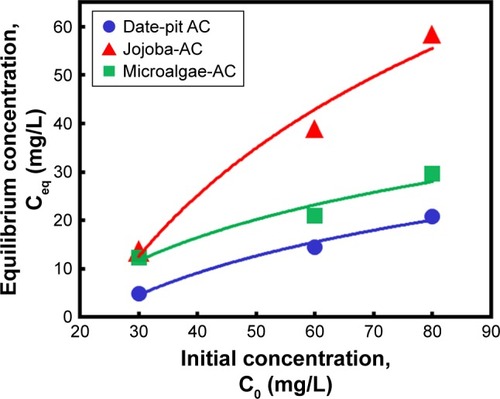
Table 2 Isotherm parameters of adsorption of bilirubin on natural materials at 37°C and pH 7.4
Figure 8 Linear isotherm plot of date-pit AC, jojoba-seed AC, and microalgae AC using (A) Langmuir model and (B) Freundlich model.
Abbreviation: AC, activated carbon.
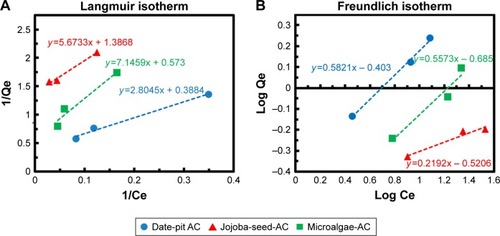
Figure 9 Viability of THLE2 cells by MTT assay.
Notes: After exposure to nano-AC for (A–C) 1, 2, and 3 hours, respectively. Means of three independent experiments are presented (P<0.05). Morphological analyses of viable cells stained with hematoxylin and eosin. (D) Control untreated THLE2 cells; (E) THLE2 cells treated with date-pit nano-AC.
Abbreviation: nano-AC, activated-carbon nanomaterial.
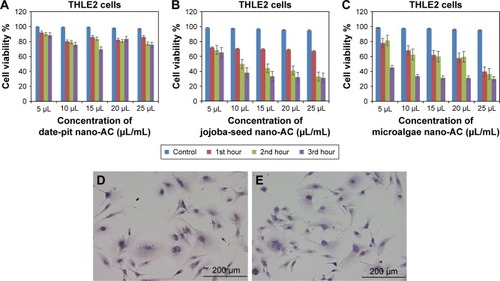
Figure 10 Viability of HepG2 cells by MTT assay.
Notes: After exposure to nano-AC for (A–C) 1, 2, and 3 hours, respectively. Means of three independent experiments are presented (P<0.05). Morphological analyses of viable cells stained with hematoxylin and eosin. (D) Control untreated HepG2 cells; and (E) HepG2 cells treated with date-pit nano-AC.
Abbreviation: nano-AC, activated-carbon nanomaterial.
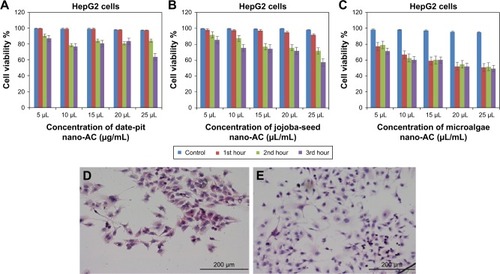
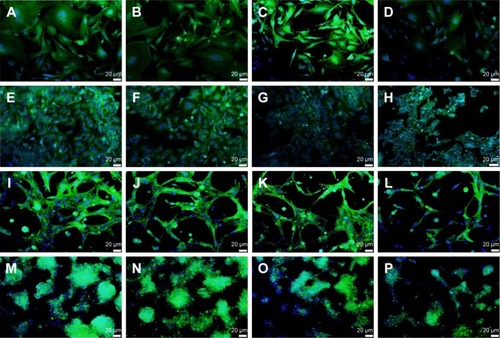
Figure 11 Fluorescence microscopy.
Notes: (A–D) 2D cultured THEL2 cells; (E–H) 2D cultured HepG2 cells; (I–L) 3D cultured THEL2 cells; (M–P) 3D cultured HepG2 cells. (A, E, I, M) Controls, (B, F, J, and N) treated with date-pit nano-AC, (C, G, K, and O) treated with jojoba-seed nano-AC, and (D, H, L, and P) treated with microalgae nano-AC for 24 hours. Actin cytoskeleton green, cell nucleus blue, scale bars 20 mm.
Abbreviation: nano-AC, activated-carbon nanomaterial.