Figures & data
Figure 1 Schematic illustration of the synthesis of 6S-PCL-PEG. The hydrophilic model drug OVA was incorporated into the hydrophilic core with a W1/O/W2 solvent evaporation method.
Abbreviations: 6S-PCL, six-arm poly(ε-caprolactone); CL, ε-caprolactone; PEG, poly(ethylene glycol); 6S-PCL-PEG, six-arm poly(ε-caprolactone)–poly(ethylene glycol); OVA, ovalbumin; W1/O/W2, water-in-oil-in-water double emulsion.
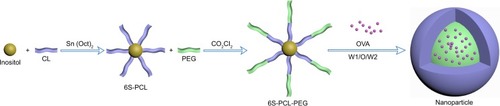
Figure 2 Synthesis and characterization of 6S-PCL and 6S-PCL-PEG. (A) 1H-NMR spectrum of 6S-PCL. (B) 1H-NMR spectrum of 6S-PCL-PEG. (C) FTIR spectrometry of 6S-PCL and 6S-PCL-PEG. (D) Molecular weights of 6S-PCL and 6S-PCL-PEG investigated by GPC.
Notes: a, (δ=4.05 ppm); b, (δ=1.66 ppm); c, (δ=1.41 ppm); and d, (δ=2.31 ppm). Compared with the 6S-PCL spectrum, the high intensity of peak e (δ=3.62 ppm, −CH2 in PEG segments) in the 6S-PCL-PEG spectrum indicated the existence of PEG.
Abbreviations: 6S-PCL, six-arm poly(ε-caprolactone); 6S-PCL-PEG, six-arm poly(ε-caprolactone)–poly(ethylene glycol); 1H-NMR, hydrogen-1 nuclear magnetic resonance; FTIR, Fourier-transform infrared; GPC, gel-permeation chromatography.
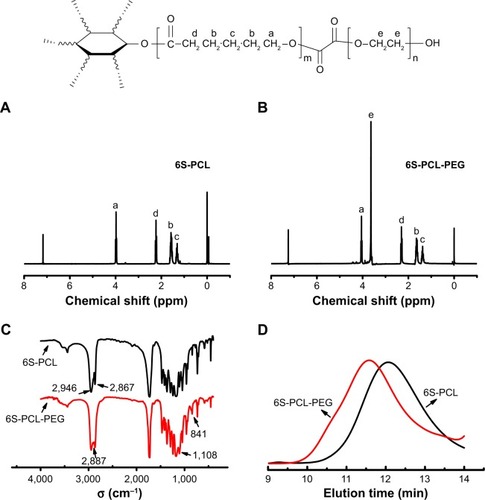
Figure 3 Biocompatibility of 6S-PCL-PEG NPs. (A) NIH-3T3 and RAW-264.7 cell viability after co-culture with NPs for 24 h. (B) Cytokine release of RAW-264.7 cells after co-culture with NPs for 24 h. Bars are mean±SD (n=3). The statistical significance of differences were analyzed using Student’s t-test: **p<0.01.
Abbreviations: 6S-PCL-PEG, six-arm poly(ε-caprolactone)–poly(ethylene glycol); NPs, nanoparticles; TNF-α, tumor necrosis factor-α.
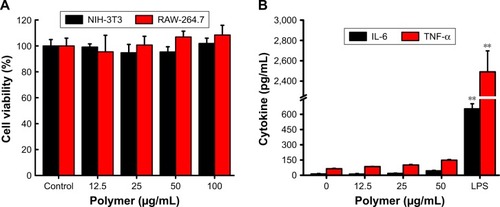
Figure 4 Characterization of 6S-PCL-PEG NPs in vitro. (A) Dynamic light scattering of 6S-PCL-PEG NPs. (B) The physical stability of 6S-PCL-PEG NPs in PBS was assessed by the change in NP size and PDI for 30 days. (C) TEM image of normal 6S-PCL-PEG NPs. Magnification is 5,000×. (D) OVA cumulative release from 6S-PCL-PEG NPs which were incubated in PBS (0.01 M, pH 7.4) for 28 days; the protein content was determined by a BCA assay. Bars are mean±SD (n=3).
Abbreviations: 6S-PCL-PEG, six-arm poly(ε-caprolactone)–poly(ethylene glycol); NPs, nanoparticles; PDI, polydispersity index; TEM, transmission electron microscopy; OVA, ovalbumin; BCA, bicinchoninic acid.
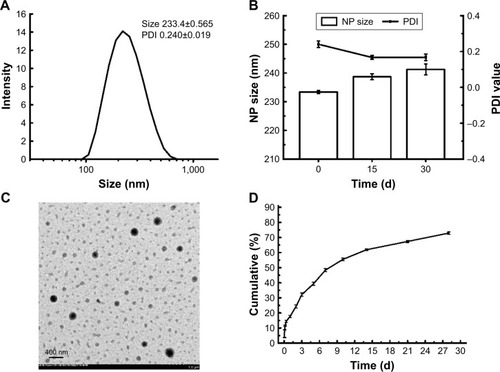
Figure 5 Secondary structure and molecular weight of OVA encapsulated into 6S-PCL-PEG NPs. (A) CD spectra of OVA. (B) Electrophoretogram of OVA. (C) Proliferation of splenocytes stimulated by OVA. Released OVA means the OVA released from NPs. Bars are mean±SD (n=5). The statistical significance of differences were analyzed using Student’s t-test: ***p<0.001.
Abbreviations: OVA, ovalbumin; 6S-PCL-PEG, six-arm poly(ε-caprolactone)–poly(ethylene glycol); CD, circular dichroism; NPs, nanoparticles.
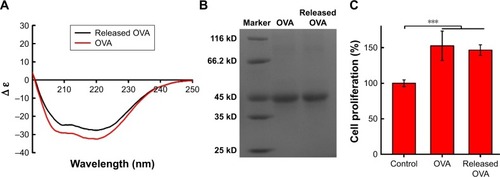
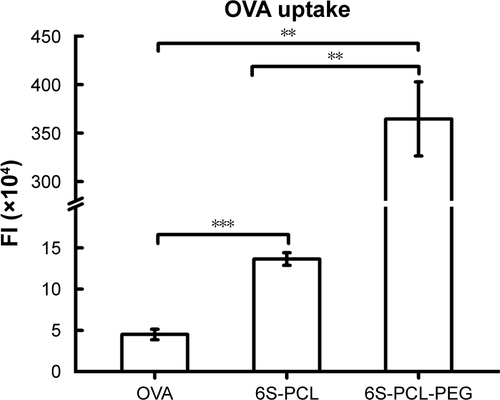
Figure 6 Cellular uptake of nanoparticles by NIH-3T3 cells. (A) NIH-3T3 cells were incubated with OVA-FITC (green) and OVA-FITC-loaded NPs for 3 h; the nucleus was labeled with DAPI (blue). The uptake of NPs was observed by confocal microscopy. (B) Percentage of OVA-FITC-positive cells. (C) Total FI of OVA-FITC; Total FI=% of positive cells × Mean fluorescence intensity. Bars are mean±SD (n=3). The statistical significance of differences were analyzed using Student’s t-test: *p<0.05, **p<0.01, ***p<0.001.
Abbreviations: 6S-PCL, six-arm poly(ε-caprolactone); 6S-PCL-PEG, six-arm poly(ε-caprolactone)–poly(ethylene glycol); OVA, ovalbumin; DAPI, 4′,6-diamidino- 2-phenylindole; BF, bright field; FITC, fluorescein isothiocyanate; FI, fluorescence intensity.
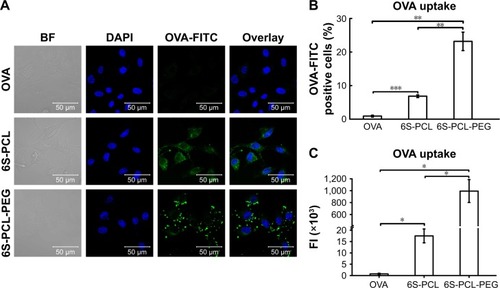
Figure S1 Integration areas of NMR spectra of 6S-PCL-PEG.
Abbreviations: NMR, nuclear magnetic resonance; 6S-PCL-PEG, six-arm poly(ε-caprolactone)–poly(ethylene glycol).
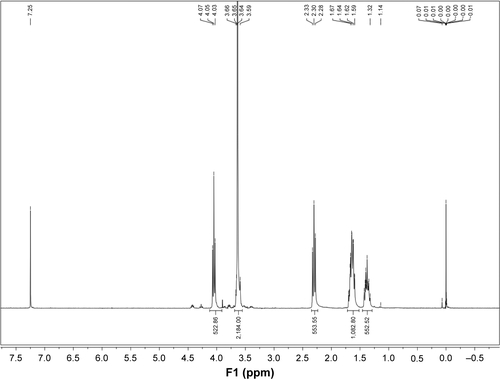
Figure S2 Size and PDI of 6S-PCL nanoparticles.
Abbreviations: PDI, polydispersity index; 6S-PCL, six-arm poly(ε-caprolactone).
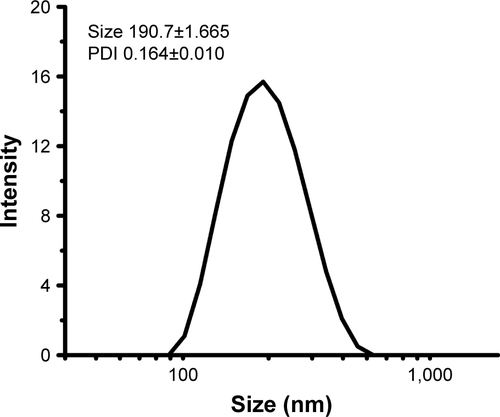
Figure S3 Representative flow plot of NPs taken up by NIH-3T3 cells.
Abbreviations: NPs, nanoparticles; OVA, ovalbumin; 6S-PCL, six-arm poly(ε-caprolactone); 6S-PCL-PEG, six-arm poly(ε-caprolactone)–poly(ethylene glycol); FITC, fluor-escein isothiocyanate.
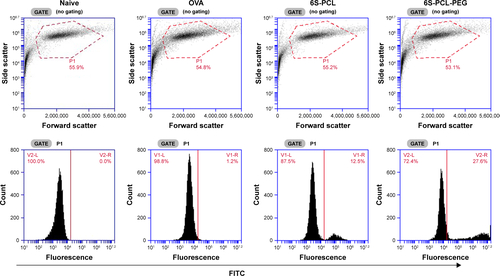
Figure S4 Mean fluorescence intensity plot of NPs taken up by NIH-3T3 cells. The statistical significance of differences were analyzed using Student’s t-test: **p<0.01, ***p<0.001.
Abbreviations: NPs, nanoparticles; OVA, ovalbumin; 6S-PCL, six-arm poly(ε-caprolactone); 6S-PCL-PEG, six-arm poly(ε-caprolactone)–poly(ethylene glycol); FI, fluorescence intensity.