Figures & data
Figure 1 Features of Dox-NCs.
Notes: (A) FTIR spectra of dextran and NCs. TEM images of NCs (B) and Dox-NCs (C). The insets in (B) and (C) were the photos of NCs in aqueous (40 mg/mL) and Dox-NCs solutions (3 mg/mL), respectively. (D) The UV-Vis absorbance spectra of Dox-NCs, NCs and Dox. The concentration of Dox-NCs was 0.5 mg/mL. The concentration of NCs was the equivalent concentration to Dox-NCs. The drug loading content of Dox was calculated by the UV-Vis calibration curve of Dox solutions at 480 nm. (E) In vitro drug release profiles of Dox-NCs at a pH of 7.4 with GSH (black curve) or without GSH (blue curve), and at pH =5.0 with GSH (red curve) or without GSH (pink curve). Dox-NCs significantly increased Dox release at a pH of 5.0 with 10 mM GSH, when compared with that at a pH of 7.4, *P<0.05, **P<0.01, ***P<0.001 (n=3).
Abbreviations: Dox, doxorubicin; FTIR, Fourier transform infrared spectroscopy; GSH, glutathione; NCs, nano-carriers; TEM, transmission electron microscopy.
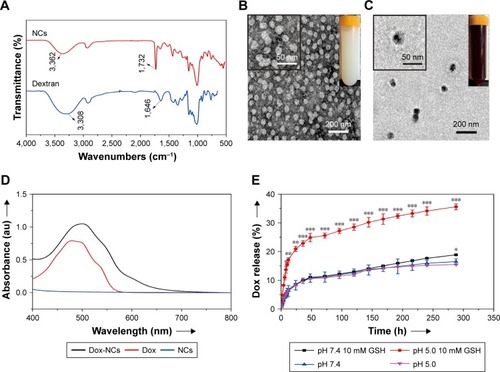
Figure 2 Dox-NCs significantly inhibited lymphoma cell growth.
Notes: (A) Jurkat and Namalwa cells were incubated with 50 nM Dox or Dox-NCs, while H9 and SU-DHL-4 cells were incubated with 42 nM Dox or Dox-NCs for indicated time. Intracellular fluorescence of Dox (red) was evaluated by flow cytometry after excitation at 595 nm. Dox-NCs (red curve) significantly increased intracellular Dox concentration in lymphoma cell lines. *P<0.05, **P<0.01, ***P<0.001 compared with Dox. (B) Cell viability was assessed by the Cell Counting Kit-8 method after 48 hours of exposure to the indicated concentration of Dox and Dox-NPs and IC50 were analyzed. The concentration of Dox and Dox-NCs were 50 nM for Jurkat and Namalwa, 42 nM for H9 and SU-DHL-4. Each value represents the mean ± SD (n=3). IC50 of Dox-NCs was significantly lower in lymphoma cell lines than those of Dox. *P<0.05, **P<0.01. (C) Lymphoma cell lines were treated with Dox and Dox-NCs for the indicated time, the concentrations of Dox and Dox-NCs were 50 nM for Jurkat and Namalwa, 42 nM for H9 and SU-DHL-4, and cell numbers were assessed by the Cell Counting Kit-8 method. The growth curves showed that Dox-NCs significantly inhibited lymphoma cell growth. *P<0.05 compared with Dox.
Abbreviations: Dox, doxorubicin; h, hours; NCs, nano-carriers.
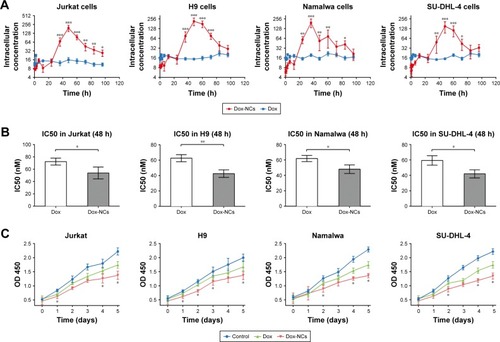
Figure 3 Dox-NCs enhanced lymphoma cell apoptosis through downregulation of survivin and activation of caspase-3.
Notes: Jurkat and Namalwa cells were incubated with 50 nM Dox or Dox-NCs for 48 hours. Dox-NCs enhanced lymphoma cell apoptosis, which was detected by two different methods, TUNEL assay (A) and Annexin V analysis (B). (C) Dox-NCs downregulated survivin expression and activated caspase-3 cleavage in both Jurkat and Namalwa cells after 48 hours treatment. Scale bar set at 50 µm, *P<0.05.
Abbreviations: Dox, doxorubicin; h, hours; NCs, nano-carriers; TUNEL, terminal deoxytransferase-catalyzed DNA-nick-end labeling assay.
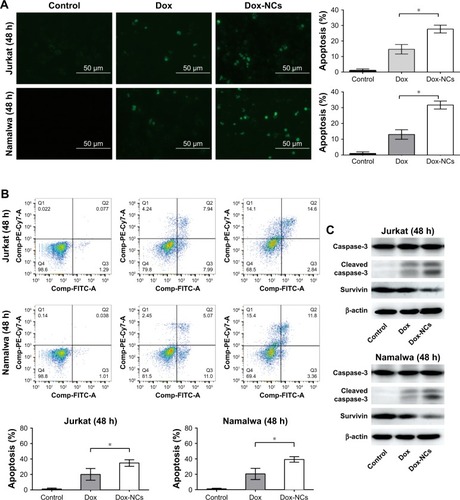
Figure 4 Dox-NCs inhibited Dox-induced P-gp expression and overcome Dox-resistance.
Notes: (A) Dox treatment (50 nM) for 48 hours upregulated P-gp expression in both Jurkat and Namalwa cells. Dox-NCs at the same concentration (50 nM) partially inhibited Dox-induced P-gp expression. (B) ATP in cell lysates were detected after 24 hours and 48 hours incubation with 50 nM Dox or Dox-NCs. After 48 hours of treatment, Dox-NCs significantly depleted ATP in both Jurkat and Namalwa cells, *P<0.05 compared with Dox. Each value represents the mean ± SD (n=3). (C) IC50 of Dox was significantly increased in Dox-resistant Jurkat and Namalwa cells when compared with their parental cells. IC50 of Dox-NCs was markedly decreased in Dox-resistant cells. *P<0.05 comparing with Dox. Each value represents the mean ± SD (n=3). (D) TUNEL assay showed that Dox-NCs enhanced apoptosis in Dox-resistant Jurkat and Namalwa cells. *P<0.05 compared with Dox. Scale bar set at 100 µm.
Abbreviations: Dox, doxorubicin; h, hours; NCs, nano-carriers; TUNEL, terminal deoxytransferase-catalyzed DNA-nick-end labeling assay.
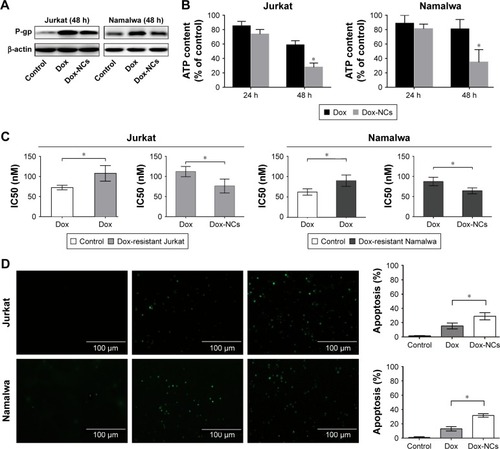
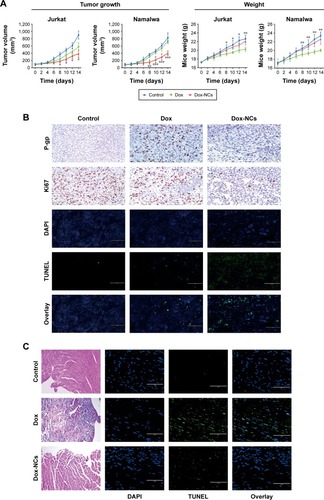
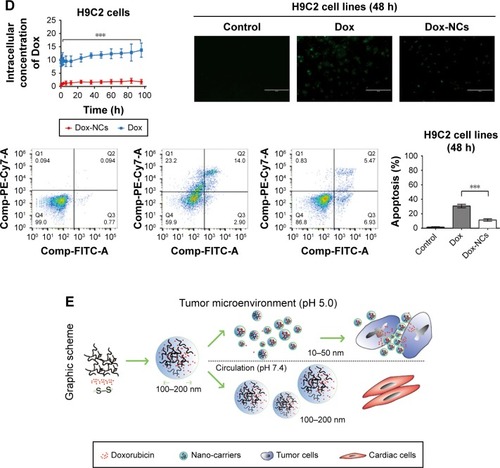
Figure 5 In vivo effects of Dox-NCs in murine lymphoma xenograft models.
Notes: (A) In both T- and B-cell lymphoma xenograft models, intraperitoneal treatment of Dox-NCs significantly inhibited tumor growth without affecting the weight of the mice. *P<0.05, **P<0.01, ***P<0.001 compared with Dox. (B) As compared with the Dox group, decreased proliferative index Ki67 and low expression of P-pg were observed in the tumors of the Dox-NC group. TUNEL assay showed that Dox-NCs enhanced tumor apoptosis significantly. Scale bar set at 100 µm. (C) Hematoxylin-eosin staining and TUNEL assay revealed diminished apoptosis of cardiac cells by Dox-NCs in vivo. Scale bar set as 100 µm (D) Dox-NCs induced cellular apoptosis to a lesser degree in cardiac cell line H9C2 than Dox. ***P<0.0001 compared with Dox. Scale bar set as 100 µm. (E) Dox-loaded dextran-based NCs are an efficient drug delivery system to treat malignant lymphoma with less cardiac toxicities.
Abbreviations: Dox, doxorubicin; h, hours; NCs, nano-carriers; TUNEL, terminal deoxytransferase-catalyzed DNA-nick-end labeling assay.