Figures & data
Figure 1 1H NMR spectra of materials in DMSO-d6.
Note: (A) 1H NMR spectra of PA-FITC; (B) 1H NMR spectra of PA.
Abbreviations: DMSO-d6, dimethylsulfoxide-d6; 1H NMR, 1H nuclear magnetic resonance; PA-FITC, fluorescein isothiocyanate-conjugated pullulan acetate.
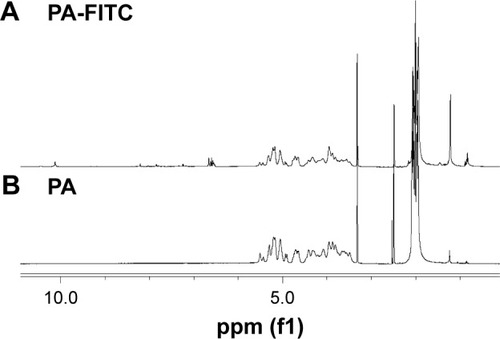
Figure 2 Morphology of PA-FITCNPs prepared by the dialysis method.
Notes: (A) TEM image of NPs; (B) SEM image of NPs.
Abbreviations: PA-FITC NPs, fluorescein isothiocyanate-conjugated pullulan acetate nanoparticles; SEM, scanning electron microscopy; TEM, transmission electron microscopy.
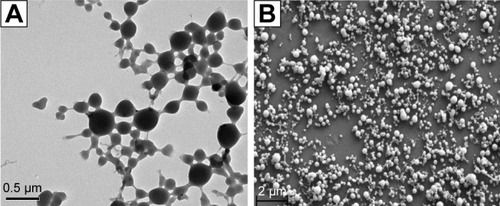
Figure 3 Cell viability of BeWo b30 cells exposed to PA-FITC NPs for 48 hours as measured by CCK-8 assay.
Note: Each value represents the mean ± SD (n=8).
Abbreviations: CCK-8, Cell Counting Kit-8; PA-FITC NPs, fluorescein isothiocyanate-conjugated pullulan acetate nanoparticles.
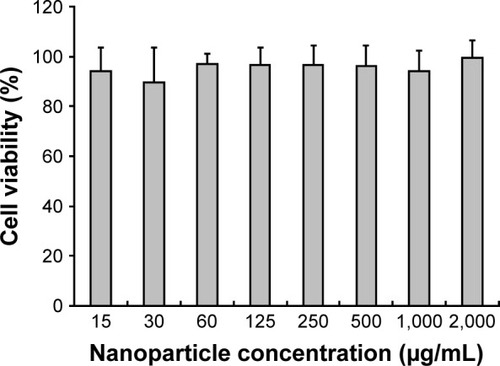
Figure 4 HCG release from BeWo b30 cells at 2, 3, and 4 days as determined by ELISA.
Notes: Data are represented as mean ± SD (n=4). **P<0.01 vs day 2.
Abbreviations: ELISA, enzyme-linked immunosorbent assay; HCG, human chorionic gonadotropin.
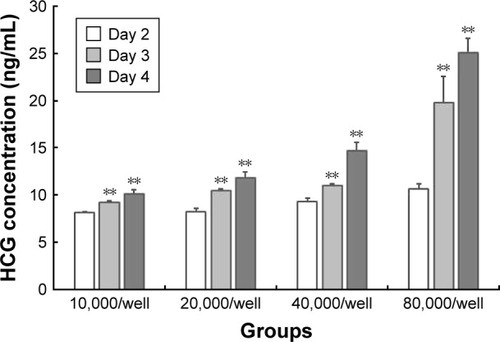
Figure 5 Effect of endocytic inhibitors on the internalization of PA-FITC NPs, evaluated by fluorescence intensity.
Notes: Data are represented as mean ± SD (n=6). **P<0.01 vs control.
Abbreviations: AMR, amiloride; Col, colchicine; CPZ, chlorpromazine; NY, nystatin; PA-FITC NPs, fluorescein isothiocyanate-conjugated pullulan acetate nanoparticles.
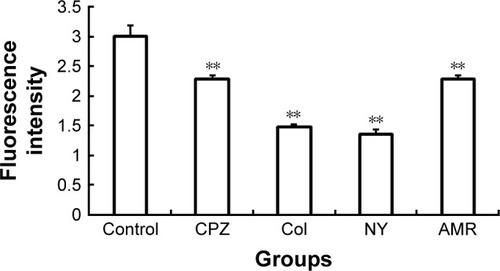
Figure 6 Formation of monolayers measured using TEER and Na-Flu transport.
Notes: (A) TEER values of cells postseeding (n=4); (B) concentration of Na-Flu transport (n=6). Data are represented as mean ± SD.
Abbreviations: Na-Flu, fluorescein sodium; TEER, transepithelial electrical resistance.
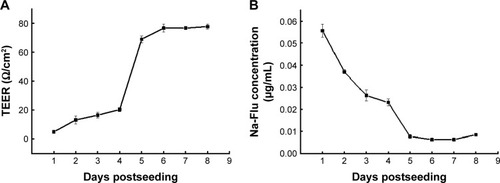
Figure 7 Confocal and TEM images of BeWo b30 cells.
Notes: BeWo b30 cells were grown on PC membranes with 3 μm pore size. Cell nuclei were stained with DAPI (blue) and tight junctions with ZO-1 (green) (A). Monolayer formation and microvilli structure: tight junctions (B) and villus structure (C).
Abbreviations: DAPI, 4′,6-diamidino-2-phenylindole; PC, polycarbonate; TEM, transmission electron microscopy; ZO-1, zonula occludens-1.
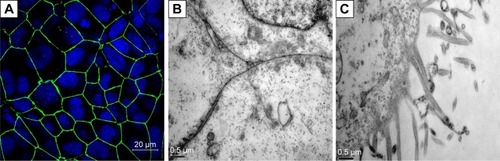
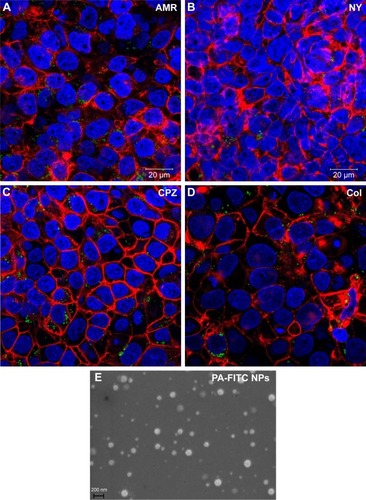
Figure 8 Confocal imaging of BeWo b30 cells and morphological characteristics of PA-FITC NPs. Transwell® cultures were treated with the endocytic inhibitors AMR, NY, CPZ, or Col.
Notes: Cell nuclei were stained with DAPI (blue), and cytoskeleton was stained with phalloidin (red), while PA-FITC NPs (green) can be seen in the cytoplasm (A–D). (E) PA-FITC NPs after transportation across the membrane, determined by SEM of the NY group, which is representative of all groups.
Abbreviations: AMR, amiloride; Col, colchicine; CPZ, chlorpromazine; DAPI, 4′,6-diamidino-2-phenylindole; mag, magnification; NY, nystatin; PA-FITC NPs, fluorescein isothiocyanate-conjugated pullulan acetate nanoparticles; SEM, scanning electron microscopy.