Figures & data
Figure 1 SEM (A) and TEM (B) micrographs of nDPB, EDS (C) of nDPB, and N2 adsorption–desorption isotherms (D) of nDPB (pore size distribution insert in D).
Note: The magnification of (A) is 6.00K, the magnification of (B) is 300.00K.
Abbreviations: EDS, energy-dispersive spectrometry; nDPB, nanoporous diopside bioglass; SEM, scanning electron microscopy; TEM, transmission electron microscopy.
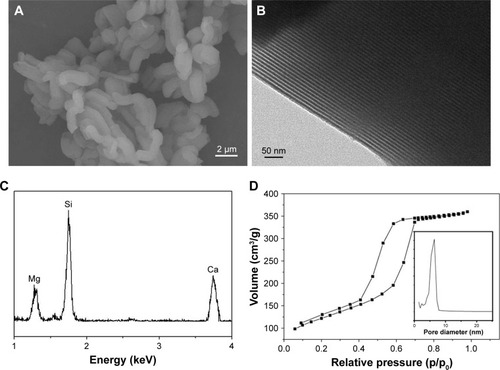
Figure 2 SEM micrographs of surface morphology of GL (A, B), 15nDGC (C, D) and 30nDGC (E, F) scaffolds; EDS mapping of GL (G), 15nDGC (H) and 30nDGC (I), and yellow dots represent Si element, indicating the distribution of nDPB particles into GL.
Note: The magnification of (A, C and E) is ×50, the magnification of (B, D and F) is ×200, the magnification of (G, H and I) is ×10,000.
Abbreviations: EDS, energy-dispersive spectrometry; GL, gliadin; nDPB, nanoporous diopside bioglass; SEM, scanning electron microscopy; 15nDGC, DGC scaffolds with 15 wt% nDPB; 30nDGC, DGC scaffolds with 30 wt% nDPB.
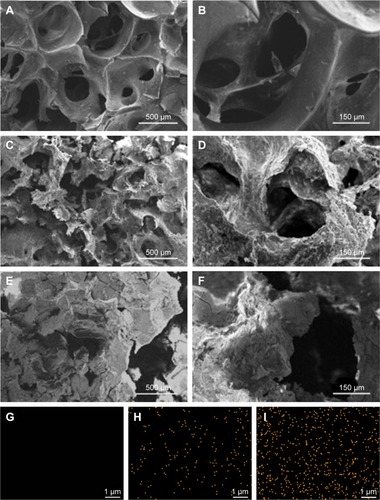
Figure 3 FTIR spectra (A) of nDPB, GL, 15nDGC and 30nDGC scaffolds; weight loss (B) of the scaffolds after being immersed in PBS solution for different time periods; pH changes (C) of solution after soaking the scaffolds in PBS for different time periods; changes of Ca, Mg, Si ion concentrations (D) in solution after soaking 30nDGC scaffolds in PBS for different time periods.
Abbreviations: FTIR, Fourier transform infrared; GL, gliadin; nDPB, nanoporous diopside bioglass; PBS, phosphate-buffered saline.
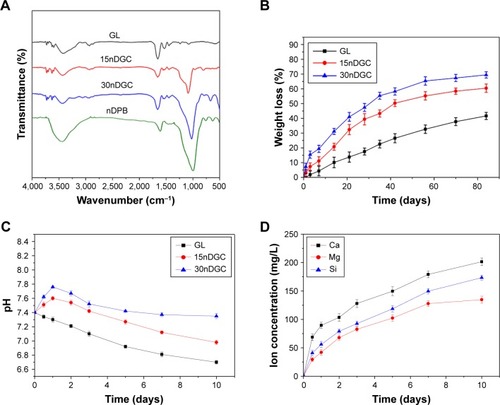
Figure 4 Cell attachment ratio (A) of the MC3T3-E1 cells on the scaffolds for 6, 12 and 24 h (*p<0.05), SEM images of cells: GL (B), 15nDGC (C) and 30nDGC (D) scaffolds for 12 h.
Note: The magnification of (B, C and D) is ×250.
Abbreviations: GL, gliadin; SEM, scanning electron microscopy.
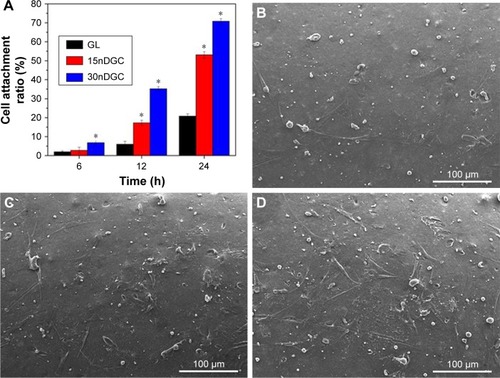
Figure 5 OD values of the MC3T3-E1 cells on GL, 15nDGC and 30nDGC scaffolds for 1, 4 and 7 days, *p<0.05.
Abbreviations: GL, gliadin; OD, optical density.
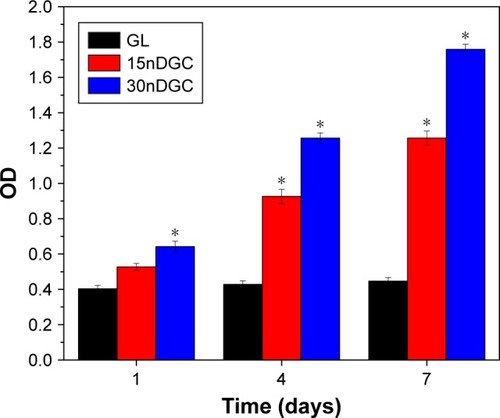
Figure 6 CLSM images of morphology of MC3T3-E1 cells after being cultured on GL, 15nDGC and 30nDGC scaffolds for 4 days.
Abbreviations: CLSM, confocal laser scanning microscopy; DAPI, 4′,6′-diamidino-2-phenylindole; FITC, fluorescein isothiocyanate; GL, gliadin.
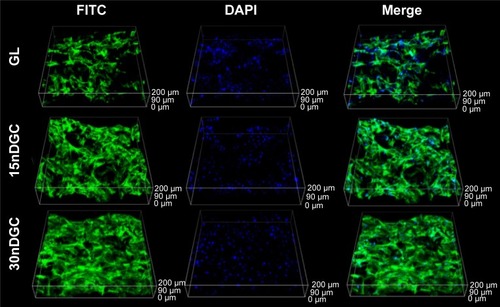
Figure 7 H&E staining of histological sections of GL (A), 15nDGC (B) and 30nDGC (C) scaffolds implanted into femoral defects for 1, 2 and 3 months.
Abbreviations: GL, gliadin; H&E, hematoxylin and eosin.
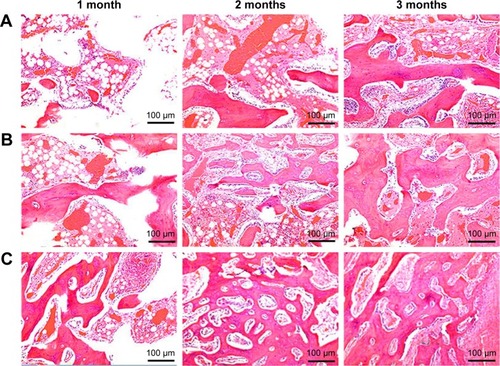
Figure 8 Percentage of new bone area (A) and material residual (B) after GL, 15nDGC and 30nDGC scaffolds were implanted into femoral defects of rabbits for 1, 2 and 3 months, *p<0.05.
Abbreviation: GL, gliadin.
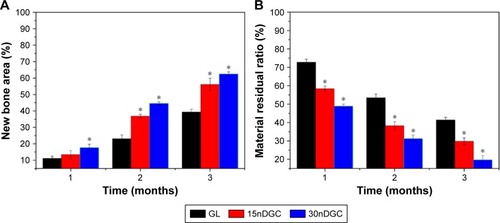
Figure 9 Immunohistological staining of type I collagen after GL (A), 15nDGC (B) and 30nDGC (C) scaffolds implanted into femoral defects of rabbits for 1, 2 and 3 months.
Notes: Arrows represent type I collagen expression. The magnification is ×100.
Abbreviation: GL, gliadin.
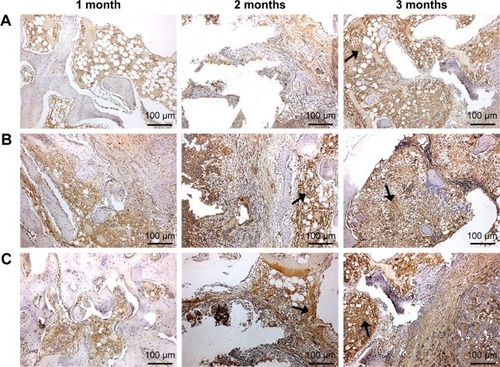
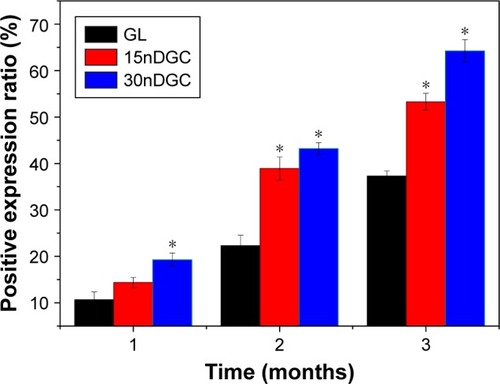
Figure 10 Quantitative analysis of the positive expression ratio of type I collagen after GL, 15nDGC and 30nDGC scaffolds implanted into femoral defects of rabbits for 1, 2 and 3 months, *p<0.05.
Abbreviation: GL, gliadin.