Figures & data
Figure 1 Topographical analysis of EVs and PEI-EV and features of PEI-EVs with varying PEI concentrations.
Notes: (A) EVs increased in dimension after the addition of PEI, and in particular PEI-EVs obtained using higher concentrations of PEI were larger than those obtained with lower PEI doses, with the exception of the 0.05 mg/mL PEI sample. (B) ζ-potential increased with higher PEI concentrations. The ζ-potential of −1.2±0.9 mV may explain the higher dimensions for PEI-EVs obtained with 0.05 mg/mL PEI, because the decreased electrostatic repulsions promoted PEI-EV aggregation. (C) EVs analyzed by tapping-mode topographic 3-D AFM were globular with a central depression. (D) PEI-EVs obtained using PEI 0.05 mg/mL, analyzed by tapping-mode topographic 3-D AFM, showed globular morphology without the central depression and less smooth surfaces.
Abbreviations: EVs, extracellular vesicles; PEI, polyethylenimine; AFM, atomic force microscopy.
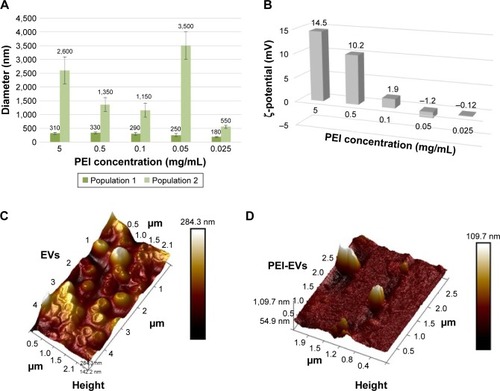
Figure 2 Confocal laser-scanning microscopy of PEI-EV (stained green with WGA Alexa Fluor 488) and hPDLSC (gray) interaction using different PEI concentrations. Notes: hPDLSCs incubated with EVs coated with PEI at 5 mg/mL (A1–A3); 0.5 mg/mL (B1–B3); 0.1 mg/mL (C1–C3), 0.05 mg/mL (D1–D3), and 0.025 mg/mL (E1–E3). PEI-EVs stained in green with WGA Alexa Fluor 488 (A1–E1). Light-transmission channels showed cell morphology (gray; A2–E2); merged images of the aforementioned channels (A3–E3). (F) Trypan blue exclusion test to evaluate the effects of different PEI concentrations on hPDLSC viability. 0.05 mg/mL PEI concentration was chosen for the other experiments. **P<0.01 compared to the other PEI concentrations; n=3; scale bars =10 μm.
Abbreviations: PEI, polyethylenimine; EV, extracellular vesicle; WGA, wheat-germ agglutinin; hPDLSC, human periodontal-ligament stem cell.
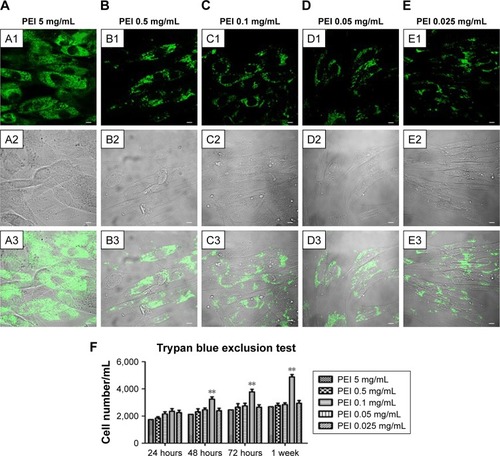
Figure 3 Confocal laser-scanning microscopy showing Evo coated with EVs and PEI-EVs.
Notes: (A) Stained EVs (green) seeded on the Evo membrane. (D) Stained-PEI-EVs (green) seeded on the Evo membrane. Microphotography confirmed the presence of EVs on the Evo surface. (B and E) The light-transmission channel shows Evo morphology (gray). (C and F) Merged images of the aforementioned channels. Microphotography confirmed the presence of PEI-EVs on the Evo surface. PEI-EVs and EVs showed the same capacity to cover the Evo surface. Scale bars =10 μm.
Abbreviations: EVs, extracellular vesicles; PEI, polyethylenimine; Evo, Evolution.
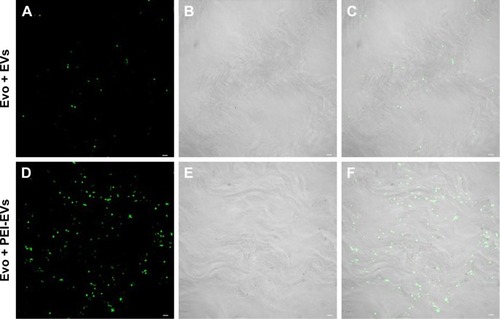
Figure 4 Evo, hPDLSCs, EVs, and PEI-EVs and osteogenic differentiation.
Notes: Photography after 6 weeks of culture and stained with Alizarin red S solution of (A) hPDLSCs, (B) Evo + hPDLSCs, (C) Evo + EVs + hPDLSCs, and (D) Evo + PEI-EVs + hPDLSCs showed that the best results in terms of production of calcium deposition were visible in Evo + PEI-EVs + hPDLSCs. (E) Colorimetric detection quantification. **P<0.01 compared to hPDLSCs.
Abbreviations: Evo, Evolution; hPDLSCs, human periodontal-ligament stem cells; EVs, extracellular vesicles; PEI, polyethylenimine.
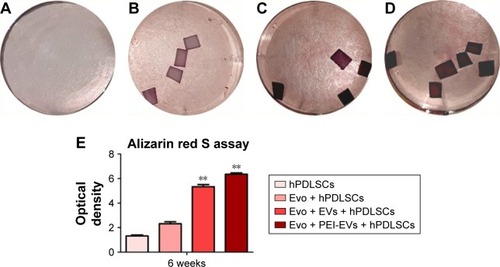
Figure 5 Relative gene-expression fold changes by qRT-PCR in Evo + hPDLSCs.
Notes: Evo + hPDLSCs compared to hPDLSCs. Evo + hPDLSCs induced the modulation of 40 genes, with only MMP8 upregulated. Transcripts showed a P-value <0.05; P-values adjusted using Benjamini–Hochberg false-discovery-rate correction.
Abbreviations: qRT-PCR, quantitative reverse-transcription polymerase chain reaction; Evo, Evolution; hPDLSCs, human periodontal-ligament stem cells; RQ, relative quantification.
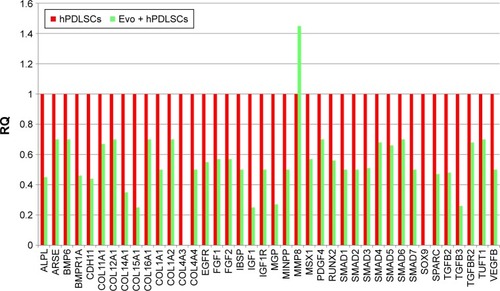
Figure 6 Relative gene-expression fold changes by qRT-PCR in Evo + EVs + hPDLSCs.
Notes: Evo + EVs + hPDLSCs compared to hPDLSCs. Cells cultured with Evo + EVs showed modulation of 36 genes, with only TGFB1 and TGFB2 upregulated. Transcripts show a P-value <0.05; P-values adjusted using Benjamini–Hochberg false-discovery-rate correction.
Abbreviations: qRT-PCR, quantitative reverse-transcription polymerase chain reaction; Evo, Evolution; EVs, extracellular vesicles; hPDLSCs, human periodontal-ligament stem cells; RQ, relative quantification.
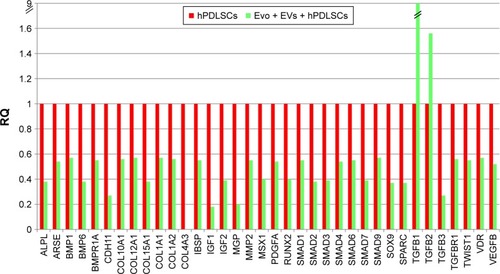
Figure 7 Relative gene-expression fold changes by qRT-PCR in Evo + PEI-EVs + hPDLSCs.
Notes: Evo + PEI-EVs + hPDLSCs compared to hPDLSCs. Cells cultured with Evo + PEI-EVs showed modulation of 40 transcripts with upregulation of nine genes, including BMP2, BMP4, COL, and TGFB1. Transcripts show a P-value <0.05; P-values adjusted using Benjamini–Hochberg false-discovery-rate correction.
Abbreviations: qRT-PCR, quantitative reverse-transcription polymerase chain reaction; Evo, Evolution; PEI, polyethylenimine; EVs, extracellular vesicles; hPDLSCs, human periodontal-ligament stem cells; RQ, relative quantification.
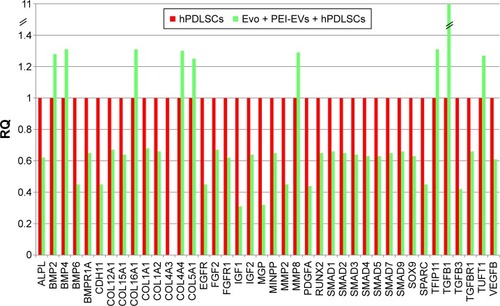
Figure 8 Macroscopic images of rat calvaria.
Notes: Six weeks after the implant of Evo, Evo + hPDLSCs, Evo + PEI-EVs, and Evo + PEI-EVs + hPDLSCs. Macroscopic evaluation showed almost complete bone repair in the Evo + PEI-EVs + hPDLSC group, while in the other groups the lesion was still present. Rectangles enclose the damaged area.
Abbreviations: Evo, Evolution; hPDLSCs, human periodontal-ligament stem cells; PEI, polyethylenimine; EVs, extracellular vesicles.
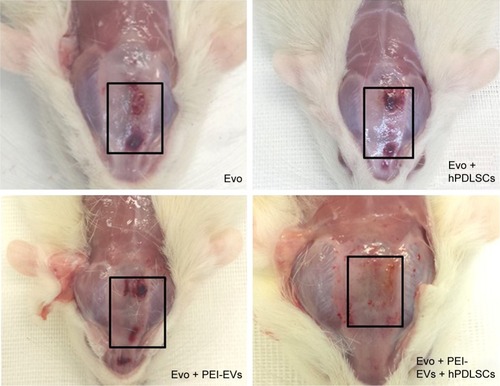
Figure 9 Histological evaluation after 6 weeks of healing.
Notes: Magnification is 4× for A1–F1 and 40× for A2–F2. (A) Evo. Membrane appeared structurally intact, able to cover all the defect area, and well integrated with the host tissue. (B) Evo + hPDLSCs. This group showed good integration with vascularized extracellular matrix around the native bone. (C) Evo + EVs. Islets of new bone were integrated with native bone. Membrane appeared closely adapted to host-bone tissue and well integrated with native bone. (D) Evo + EVs + hPDLSCs. (E) Evo + PEI-EVs. Evo was well integrated with host tissue, and extracellular matrix was present in defect area. (F) Evo + PEI-EVs + hPDLSCs. The implant site was covered with an organized extracellular matrix with mineralization areas, and osteoblast-like structures were visible. C, mouse calvarium; *Evo; arrows, osteoblast-like cells. Scale bars =10 μm.
Abbreviations: Evo, Evolution; hPDLSCs, human periodontal-ligament stem cells; EVs, extracellular vesicles; PEI, polyethylenimine.
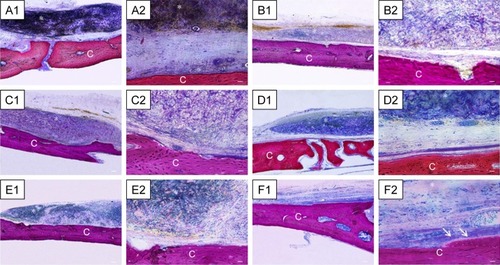
Table 1 Summary of in vivo findings of the different experimental groups
Figure 10 In vitro and in vivo BMP2/4 expression.
Notes: (A) qRT-PCR graph showing different BMP2/4 expression in hPDLSCs, Evo + hPDLSCs, Evo + EVs + hPDLSCs, and Evo + PEI-EVs + hPDLSCs after 6 weeks of in vitro culture (n=3, **P<0.01 compared to hPDLSCs, Evo + hPDLSCs, and Evo + EVs + hPDLSCs). Evo + PEI-EVs + hPDLSCs showed the highest expression. (B) Western blot analysis of BMP2/4 confirmed the gene-expression results. Immunofluorescence staining of BMP2/4 showed the presence of the protein in semithin section samples obtained after 6 weeks of grafting in rat calvaria in (C) Evo, (D) Evo + hPDLSCs, (E) Evo + EVs, (F) Evo + EVs + hPDLSCs, (G) Evo + PEI-EVs, and (H) Evo + PEI-EVs + hPDLSCs. The results showed higher protein expression in Evo + PEI-EVs + hPDLSCs, confirming the in vitro data. Magnification 20×; C, mouse calvarium; *Evo; Scale bars =10 μm.
Abbreviations: qRT-PCR, quantitative reverse-transcription polymerase chain reaction; hPDLSCs, human periodontal-ligament stem cells; Evo, Evolution; EVs, extracellular vesicles; PEI, polyethylenimine.
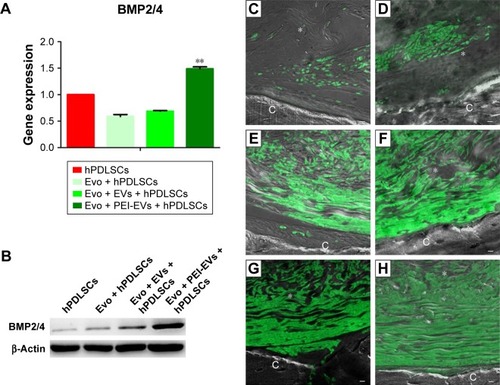
Figure S1 Evolution membrane.
Notes: Back (A) and front (B) of a commercially available collagen membrane (Evolution; Tecnoss Dental, Giaveno, Italy). (C) Cytofluorometric evaluation. (D) hPDLSC plastic adherent cells. (E) Osteogenically differentiated hPDLSCs stained with Alizarin red. (F) Adipogenically committed hPDLSCs stained with oil red O solution. Scale bars =5 μm.
Abbreviations: hPDLSC, human periodontal-ligament stem cell; ND, not detectable; SD, standard deviation.
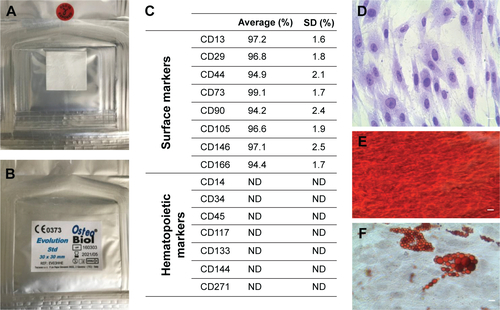
Figure S2 IPA functional analysis.
Notes: (A) IPA biological functions analysis shows that key functions related to connective and skeletal-tissue development were modulated by the selected genes for Evo + hPDLSCs compared to hPDLSCs. (B) Gene network.
Abbreviations: IPA, Ingenuity Pathway Analysis; hPDLSCs, human periodontal-ligament stem cells; Evo, Evolution.
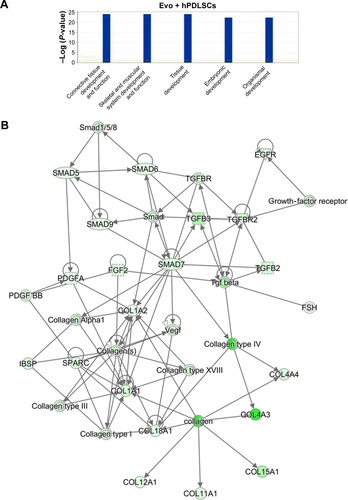
Figure S3 IPA functional analysis.
Notes: (A) IPA biological function analysis shows that key functions related to connective and skeletal-tissue development were modulated by the selected genes for Evo + EVs + hPDLSCs compared to hPDLSCs. (B) Gene network.
Abbreviations: IPA, Ingenuity Pathway Analysis; Evo, Evolution; EVs, extracellular vesicles; hPDLSCs, human periodontal-ligament stem cells.
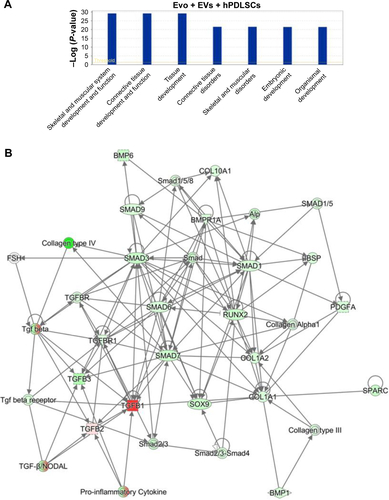
Figure S4 IPA functional analysis.
Notes: (A) IPA biological function analysis shows that key functions related to connective and skeletal-tissue development were modulated by the selected genes for Evo + PEI-EVs + hPDLSCs compared to hPDLSCs. (B) Gene network.
Abbreviations: IPA, Ingenuity Pathway Analysis; Evo, Evolution; PEI, polyethylenimine; EVs, extracellular vesicles; hPDLSCs, human periodontal-ligament stem cells.
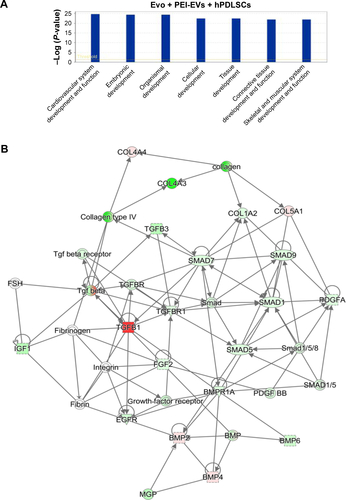
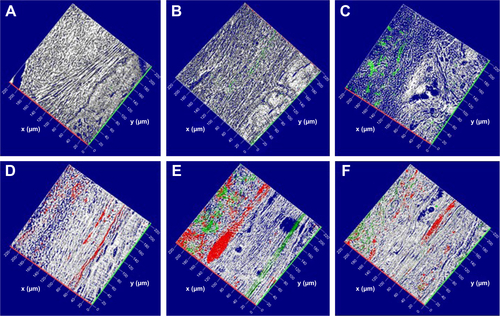
Figure S5 Confocal laser-scanning microscopy analysis.
Notes: 3-D reconstruction of (A) Evo, (B) Evo loaded with EVs, (C) Evo loaded with PEI-EVs, (D) Evo loaded with hPDLSCs, (E) Evo loaded with hPDLSCs and EVs, and (F) Evo loaded with hPDLSCs and PEI-EVs. hPDLSCs were stained with PKH26 (red), EVs and PEI-EVs stained with PKH76 (green), and Evo observed through a light-transmission channel (gray). The images show the spatial interaction of Evo with hPDLSCs, EVs and PEI-EVs. Calvarium slices in the presence of Evo, Evo + EVs, and Evo + PEI-EVs evidenced the link between Evo and labeled EVs. Moreover, many PKH26-labeled hPDLSCs linked to PKH76-stained EVs were localized at the cytoplasmic membrane and on the Evo surface. x- and y-axes indicate length and width, respectively.
Abbreviations: Evo, Evolution; EVs, extracellular vesicles; PEI, polyethylenimine; hPDLSCs, human periodontal-ligament stem cells.