Figures & data
Figure 1 (A) Schematic figure depicting the additive laser direct deposition of arbitrary 3D parts (B) Photos of a tensile test sample and a hip implant produced by additive laser direct deposition of NiTi (C) Surface of NiTi by additive laser direct deposition observed under scanning electron microscope, showing dense microstructure. Scale bar: 50 µm (D) Schematic figure for NPLS of composite nanocoatings on arbitrary 3D parts (E) Preparation process of sNiTi, sNiTi/HA-acid, and sNiTi/HA. These three types of samples were used as cell test substrates. (F) Proposed pore formation mechanism during NPLS assisted by HA nanoparticles; (G) Surface structure of sNiTi; (H) Surface structure of sNiTi/HA-acid; (I) Surface structure of sNiTi/HA, with high-magnification image insert; (J) EDS spectrum from sNiTi/HA-acid; (K) EDS spectrum from sNiTi/HA. Scale bar: 5 µm for (G–I) and 200 nm for insert (G).
Abbreviations: HA, hydroxyapatite; NiTi, nitinol; NPLS, nanosecond pulsed laser sintering; sNiTi, sintered NiTi.
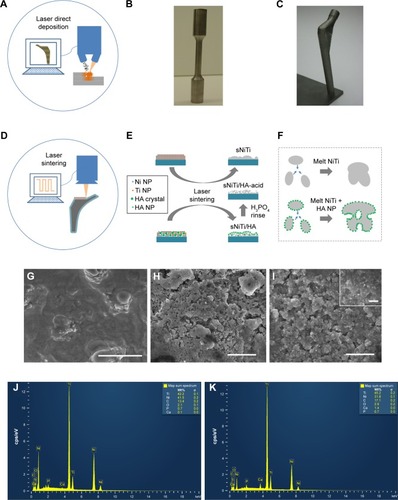
Table 1 Weight ratios of various elements on sNiTi/HA and sNiTi/HA-acid samples from quantitative EDS analysis
Figure 2 (A) XRD analysis of the nitinol sample synthesized by laser direct deposition; (B) XRD pattern of pre-coated layer (red) and nanosecond pulsed laser-sintered coating of NiTi/HA (blue); (C) Nanoindentation test showing modulus and hardness along the sample depth; the sNiTi/HA coating shows higher modulus and hardness than the NiTi substrate; (D) and (E) Load-displacement relations from nanoindentation test with cube corner indenter near the interface between the coating and the substrate; inserted are the SEM observation of the corresponding dents.
Abbreviations: HA, hydroxyapatite; NiTi, nitinol; sNiTi, sintered NiTi.
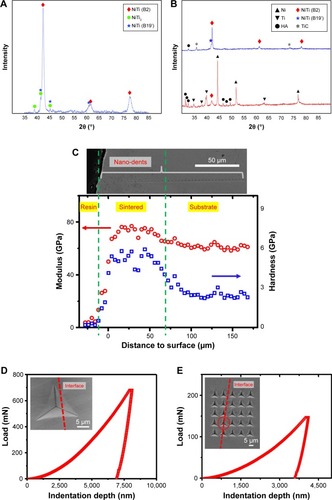
Figure 3 Osteoblast morphology on different sNiTi plates.
Notes: After 3 days of osteoblast culture, the top view of the cell monolayers was imaged by SEM: (A) sNiTi; (B) and (D) sNiTi/HA-acid; (C) and (E) sNiTi/HA. Representative areas in (A–C) showing mineral deposits (yellow arrows), cell nuclei (blue arrows), and lamellipodia (red arrows). Some cells displayed a dome shape on sNiTi/HA-acid, as in (D); and sNiTi/HA, as in (E); no similar cells were found for sNiTi. Cross sections of the osteoblast monolayer were also imaged: (F) sNiTi; (G) sNiTi/HA-acid; (H) sNiTi/HA. A fibrous structure which is highlighted by yellow rectangles was observed in (G) and (H) and possibly represents extracellular matrix. The red rectangle in (H) indicates possible mineralized microspheres attached to the cell monolayer. Scale bar: 10 µm.
Abbreviations: HA, hydroxyapatite; NiTi, nitinol; sNiTi, sintered NiTi.
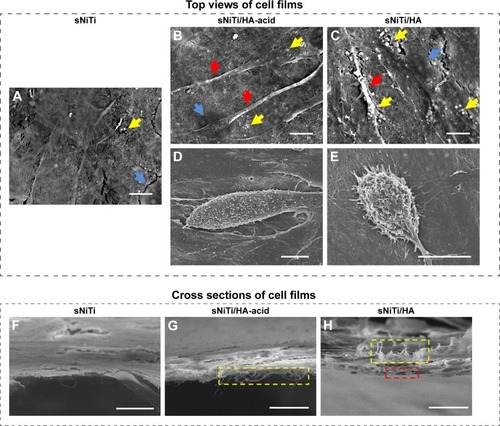
Table 2 Weight ratios of elements on subcellular structures after culture with osteoblasts for 3 days. sNiTi and highlighted areas in for the sNiTi/HA and sNiTi/HA-acid samples were analyzed using quantitative EDS analysis
Figure 4 Subcellular morphology of plates after osteoblast culture.
Notes: (A) sNiTi; (C) sNiTi/HA-acid; and (E) sNiTi/HA plates after osteoblasts were cultured for 3 days. In (C) and (E), the red dashed lines indicate the borders between the carbon-rich layers identified by carbon element mapping, which was generated by osteoblasts, compared with bare areas. (B, D and F) are representative images showing the carbon element mapping for imaged areas on sNiTi, sNiTi/HA-acid, and sNiTi/HA, respectively. (G) Magnified morphology of the highlighted area in (E) showing fractured lamellipodial cell extensions and cells (red arrows). Scale bar: 10 µm.
Abbreviations: HA, hydroxyapatite; NiTi, nitinol; sNiTi, sintered NiTi.
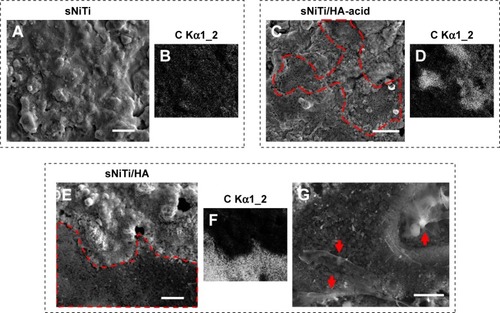
Figure 5 Expression levels of osteoblast biomarkers on sNiTi, sNiTi/HA-acid, and sNiTi/HA surfaces.
Notes: Osteoblasts were differentiated on the three sNiTi surfaces and the mRNA expression of osteoblastic markers was analyzed by qPCR. The relative gene expression was compared for each metal compared with the NiTi control for each gene: (A) collagen type 1a, (B) ALP, (C) OCN, and (D) FAK. qPCR experiments were performed in triplicate and replicated three times, and representatives of these data are shown. GAPDH was used as the housekeeping gene. (*) indicates statistical significance of P<0.05. (E) A schematic representation of an osteoblast is shown. Osteoblasts express ALP, OCN, and collagen type 1 which are necessary for extracellular matrix formation. Osteoblast adhesion is regulated by actin, FAK, and other focal adhesion proteins (not shown).
Abbreviations: ALP, alkaline phosphatase; FAK, focal adhesion kinase; HA, hydroxyapatite; NiTi, nitinol; OCN, osteocalcin; sNiTi, sintered NiTi.
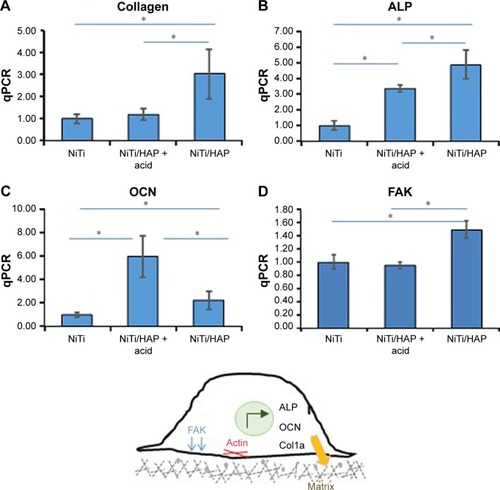
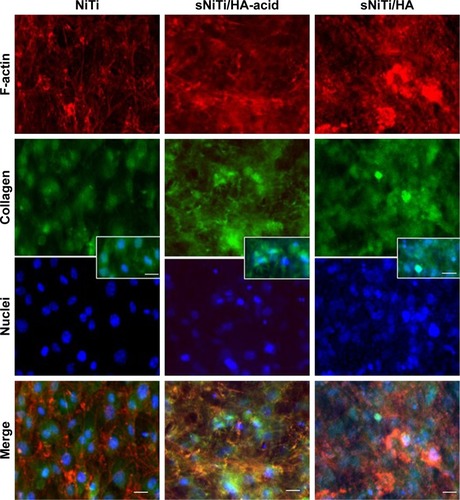
Figure 6 Immunofluorescent staining of osteoblasts on NiTi, sNiTi/HA-acid, and sNiTi/HA surfaces.
Notes: Osteoblasts were differentiated on the metals and then stained for phalloidin which detects filamentous actin (F-actin; red) or collagen (green). Cell nuclei were stained with DAPI (blue). The fluorescent images of each stain are shown separately and as merged image. All images were taken at 20×. The scale bar indicates 10 µm. The inset shows higher magnification of double-labeled cells showing collagen and cell nuclei for each of the substrates.
Abbreviations: HA, hydroxyapatite; NiTi, nitinol; sNiTi, sintered NiTi.