Figures & data
Figure 1 (A) Results indicating photographic images of polypyrrole (Ppy) and Ppy–PEI NCs and their microscopic TEM. (B) Results of SEM showing prepared Ppy–PEI NCs with nano-size. DLS study shows the size distribution (C), zeta potential (D), and polydispersity index (E) of the different pH environments.
Abbreviations: NC, nanocomplex; PEI, polyethylenimine; SEM, scanning electron microscopy; TEM, transmission electron microscopy; DLS, dynamic light scattering.
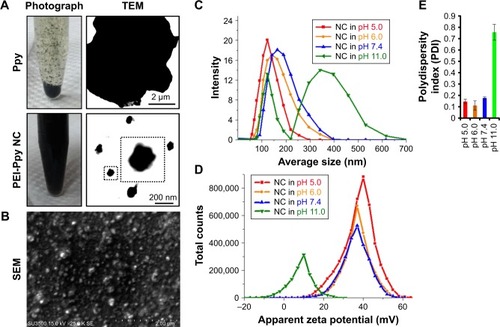
Figure 2 Photothermal property results. Temperature profile (A) at different concentrations of prepared NC and (B) at different pH environments. (C) Photothermal images (temperature value recorded by Thermocouple). The temperature elevated to 25 degree celsius is considered time 0 second.
Abbreviations: DI, deionized; NC, nanocomplex.
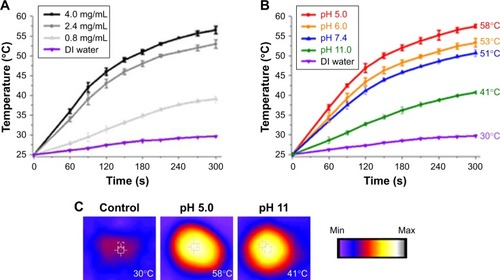
Figure 3 (A) Fluorescence results show binding affinity of prepared NC in differently charged hydrogels and (B) their thermal properties. (C) Chemical structural change studied by Fourier transform infrared spectroscopy.
Note: *Statistically significant, P < 0.05.
Abbreviations: Cy, cyanine; NC, nanocomplex; NIR, near-infrared; PEI, polyethylenimine.
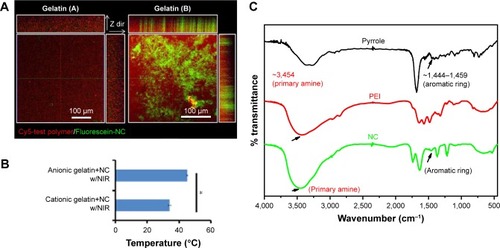
Figure 4 (A) Fluorescent images show cell interaction with different formulations. (B) Fluorescence intensity was calculated by ImageJ software, and the statistical data analysis compared with NC/NIR (cy5-). NC Fluorescence group, left: NC, right: NC/NIR).
Notes: Black bar is ROS studied group; red bar is H2O2 studied group. *Statistically significant, P < 0.05.
Abbreviations: H2O2, hydrogen peroxide; NC, nanocomplex; NIR, near-infrared; ns, nonsignificant; ROS, reactive oxygen species; DAPI, 4′,6-diamidino-2-phenylindole.
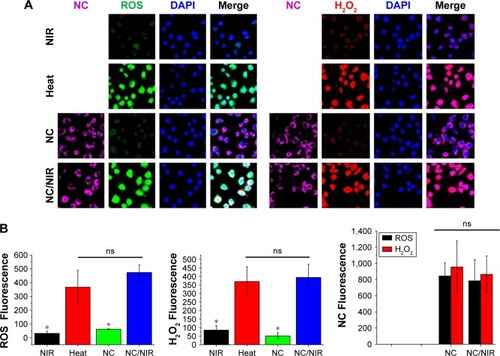
Figure 5 (A) Quantitative results of MTT cell viability with different treatments, comparison of control and PEI-Ppy. (B) The group of Ppy–PEI NCs attached onto cell membranes morphologically imaged by SEM. (C) The cell viability was qualitatively tested with a Live/Dead method.
Note: *Statistically significant, P < 0.05.
Abbreviations: NC, nanocomplex; NIR, near-infrared; PEI, polyethylenimine; Ppy, polypyrrole; SEM, scanning electron microscopy.
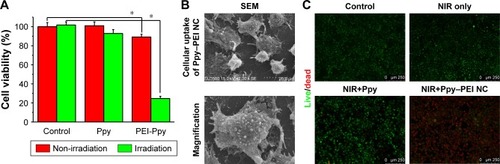
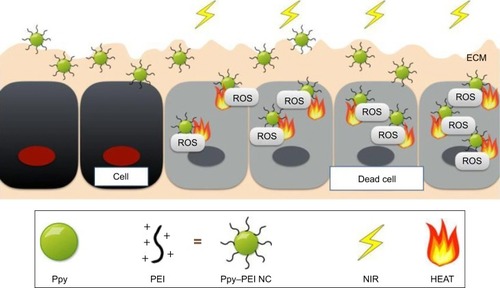
Figure 6 Schematic illustration showing the developed Ppy–PEI NCs bioapplied for lung cancer treatment.
Abbreviations: ECM, extracellular matrix; NC, nanocomplex; NIR, near-infrared; PEI, polyethylenimine; Ppy, polypyrrole; ROS, reactive oxygen species.