Figures & data
Table 1 Average nanoparticle diameter
Figure 1 Representative transmission electron microscope images of A) 20 nm, B) 40 nm, and C) 60 nm citrate-stabilized gold nanoparticles in water. Scale bars 100 nm.
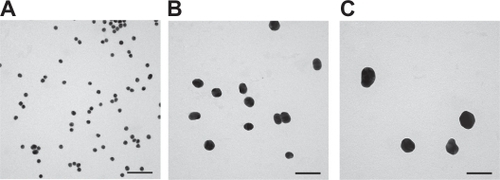
Figure 2 Darkfield images (exposure time 257.3 msec) of mesenchymal stem cells incubated for 24 hours with B) 20 nm citrate-stabilized (CS), C) 20 nm poly-L-lysine (PLL), D) 40 nm citrate-stabilized, E) 40 nm poly-L-lysine, F) 60 nm citrate-stabilized, and G) 60 nm poly-L-lysine media. A) A control darkfield image and A1) phase-contrast image of mesenchymal stem cells not incubated with nanoparticles is shown for comparison. Scale bars 100 μm.
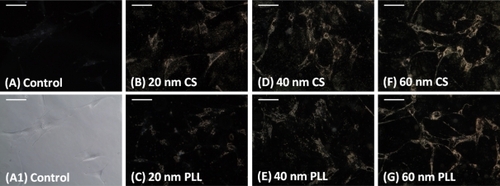
Figure 3 After 24 hours of incubation with nanoparticles, the particles were removed and LIVE/DEAD and MTT assays were performed. A) Representative LIVE/DEAD images of cells incubated with nanoparticles for 24 hours and assessed at various time points after nanoparticle removal over a two-week period. Cells which appear green were considered live and those which appear red were considered dead (indicated by white arrows). Scale bar 100 μm. B) An MTT assay was used to assess nanoparticle cytotoxicity by quantifying cell number over a one-week period using a plate reader at 562 nm. Data are shown as mean ± standard error. Significantly lower differences in cell number from the control for the corresponding day are indicated by an asterisk (P < 0.01).
Abbreviations: CS, citrate-stabilized; PLL, poly-L-lysine.
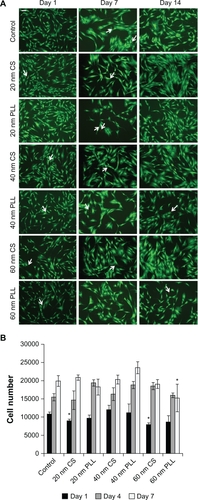
Figure 4 The bipotent ability of mesenchymal stem cells to differentiate into adipogenic and osteogenic lineages was assessed after 24 hours of nanoparticle incubation. Control cells were not incubated with nanoparticles. Control (+) cells were induced to differentiate and control (−) cells were not induced to differentiate. A) Oil red O staining was used to assess adipogenic differentiation by staining for lipid deposits (white arrows). B) von Kossa staining was used to assess osteogenic differentiation by staining for calcium deposits (red arrows). Scale bar 100 μm.
Abbreviations: CS, citrate-stabilized; PLL, poly-L-lysine.
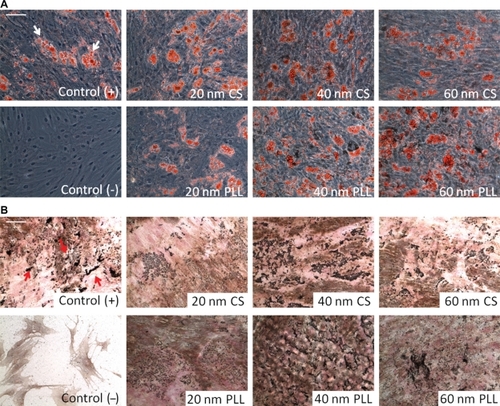
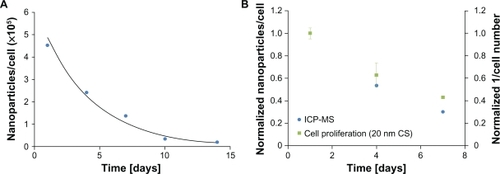
Figure 5 A) Nanoparticle uptake and retention over a two-week period were assessed using inductively coupled plasma mass spectrometry (ICP-MS) for cells incubated with 20 nm citrate-stabilized (CS) nanoparticles for 24 hours. The results are shown as the average number of nanoparticles/cell ± standard error. B) Comparison of the normalized values for the average number of nanoparticles/cell and the inverse of cell proliferation over time for control and 20 nm citrate-stabilized cells. The results are shown as the mean ± standard error.