Figures & data
Figure 1 Expression and purification of S-Fab from E. coli.
Notes: (A) The bacterial S-Fab expression constructs contain a pelB signal sequence, anti-CD3 (human UCTH1 clone) VH (or VL) and CH1 (CL), and anti-CEA-VHH. To facilitate antibody detection and purification, a flag-tag and his6-tag were added to the C-terminal end of the heavy and light chains, respectively. (B) Schematic representation of S-Fab after co-expression. (C) Coomassie blue-stained SDS-PAGE chromatogram of purified S-Fab after the two-step purification. + indicates reducing condition (2 μM 2-mecaptoethanol); - indicates nonreducing condition (no 2-mecaptoethanol). (D) Gel filtration analysis showing that the molecular weight of S-Fab was ~130 kDa. M (kDa), molecular weight markers (kilodalton).
Abbreviations: CEA, carcinoembryonic antigen; E. coli, Escherichia coli; S-Fab, single-domain antibody-linked Fab; SDS-PAGE, sodium dodecyl sulfate polyacrylamide gel electrophoresis; UV, ultraviolet.
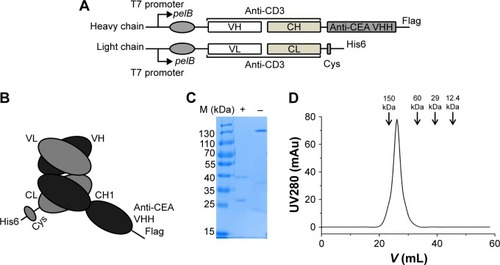
Figure 2 PEGylation of bispecific S-Fab using 20 kDa linear MAL-PEG-OMe.
Notes: S-Fab was reacted with the functionalized PEG at a series of ratios (0:1, 10:1, 20:1, 40:1, and 60:1 molar equivalents of PEG:S-Fab). After shaking at 22°C for 2 h, the samples were examined by reducing SDS-PAGE (5 μL per sample). (A) Coomassie blue staining of S-Fab with different molar ratios of PEG:S-Fab during PEGylation. (B) Barium iodide complex dye staining for S-Fab with different molar ratios of PEG:S-Fab. (C) Western blotting assay using an antiflag antibody to detect the VH-CH-CEA chain. (D) Western blotting assay using an anti-His6 antibody to detect the VL-CL chain. Numbers 0, 10, 20, 40, and 60 represent the molar ratio of PEG:Fab at 0:1, 10:1, 20:1, 40:1, and 60:1, respectively. M (kDa), molecular weight markers (kilodalton).
Abbreviations: CEA, carcinoembryonic antigen; MAL-PEG-OMe, methoxy PEG maleimide; PEG, polyethylene glycol; S-Fab, single-domain antibody-linked Fab; SDS-PAGE, sodium dodecyl sulfate polyacrylamide gel electrophoresis.
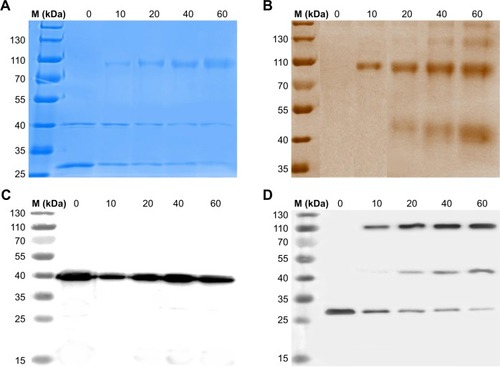
Figure 3 Purification of PEG-S-Fab.
Notes: Gel filtration was used to fractionate the PEGylation mixture (fractions 1, 2, and 3). (A) Chromatogram of PEG-S-Fab. (B) Coomassie blue staining of the fractions 1, 2, and 3 from PEG-S-Fab purification. (C) Barium iodide complex staining of the fractions 1, 2, and 3 from PEG-S-Fab purification. M (kDa), molecular weight markers (kilodalton).
Abbreviations: PEG, polyethylene glycol; PEG-S-Fab, PEGylated S-Fab; S-Fab, single-domain antibody-linked Fab; UV, ultraviolet.
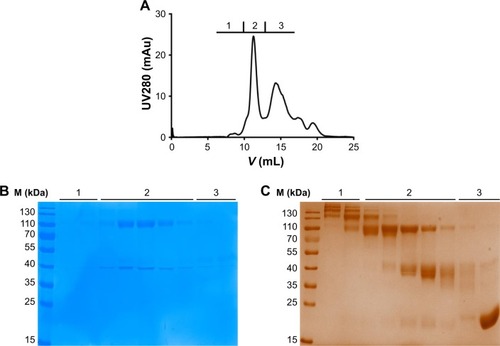
Figure 4 PEG-S-Fab can bind CEA on tumor cells and CD3+ on T cells.
Notes: Flow cytometry analysis of PEG-S-Fab and S-Fab on CEA-positive LS174T cells (A), CEA-negative SKOV3 cells (B), and CD3+ T cells (C). The positive control anti-CD3 antibody OKT3 was used for T-cell flow cytometry. Confocal microscopy of immunofluorescence staining as described in the “Materials and methods” section. S-Fab (D) and PEG-S-Fab (E) on LS174T cells (upper panel) and SKOV3 cells (lower panel), respectively. The scale bar represents 30 μm. AF488, stained by the goat antihuman IgG (H + L)-AlexaFluor 488 antibody; LS174T, human colorectal cell line LS174T; SKOV3, human ovarian cancer cell line SKOV3.
Abbreviations: CEA, carcinoembryonic antigen; DAPI, 4′,6-diamidino-2-phenylindole; IgG, immunoglobulin G; PEG, polyethylene glycol; PEG-S-Fab, PEGylated S-Fab; S-Fab, single-domain antibody-linked Fab; FITC, fluoresceine isothiocyanate.
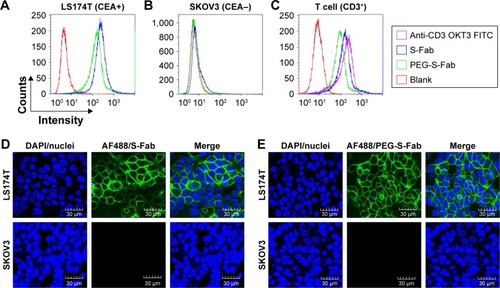
Figure 5 PEG-S-Fab has potent specific cytotoxicity against tumor cells.
Notes: (A) Cytotoxic assay using CEA-positive LS174T cells. (B) Cytotoxic assay using CEA-negative SKOV3 cells. Cytotoxic assays were performed as described in the “Materials and methods” section. Different concentrations of S-Fab or PEG-S-Fab were incubated with tumor cells and effector T cells (E/T =10). All data are shown as the mean of triplicates, with error bars representing the SEM. LS174T, human colorectal cell line LS174T; SKOV3, human ovarian cancer cell line SKOV3.
Abbreviations: CEA, carcinoembryonic antigen; PEG, polyethylene glycol; PEG-S-Fab, PEGylated S-Fab; PEG-S-Fab + T, PEG-S-Fab plus T cells; S-Fab, single-domain antibody-linked Fab; S-Fab + T, S-Fab plus T cells; SEM, standard error of the mean.
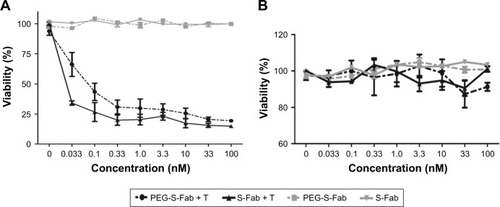
Figure 6 Pharmacokinetic (A and B) and stability (C–F) analyses of the serum concentrations of PEG-S-Fab and S-Fab.
Notes: (A) Standard curve for the ELISA. (B) Serum PEG-S-Fab concentration–time curve after intravenous administration. Each data point is expressed as the mean ± SEM. Western blotting assay to detect the heavy chain of resulting S-Fab (C) or PEG-S-Fab (D) using an antiflag antibody after incubation with human plasma. Western blotting assay to detect the light chain of resulting S-Fab (E) or PEG-S-Fab (F) using an anti-His antibody after incubation with human plasma. M (kDa), molecular weight markers (kilodalton); P, plasma only group.
Abbreviations: PEG, polyethylene glycol; PEG-S-Fab, PEGylated S-Fab; S-Fab, single-domain antibody-linked Fab; SEM, standard error of the mean; ELISA, enzyme-linked immunosorbent assay.
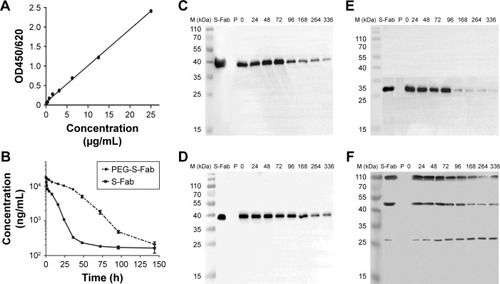
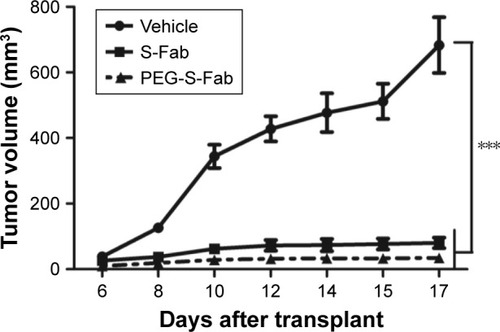
Figure 7 PEGylation of S-Fab induces a more potent in vivo antitumor activity.
Notes: NOD–SCID mice (n=6 per group) were subcutaneously engrafted with LS174T cells and human PBMCs. Mice were then treated with PBS alone, 0.3 nmol of S-Fab or PEG-S-Fab daily over 6 days. The data represent the average tumor volume of six mice. The error bars represent the SEM. Data were analyzed by a two-way ANOVA using the GraphPad Prism 5 software (GraphPad Software, La Jolla, CA, USA). ***P<0.01 when comparing the vehicle with the S-Fab or PEG-S-Fab groups. LS174T, human colorectal cell line LS174T.
Abbreviations: ANOVA, analysis of variance; NOD–SCID, nonobese diabetic–severe combined immuno deficiency; PBMCs, peripheral blood mononuclear cells; PBS, phosphate-buffered saline; PEG, polyethylene glycol; PEG-S-Fab, PEGylated S-Fab; SEM, standard error of the mean; S-Fab, single-domain antibody-linked Fab.