Figures & data
Table 1 Genes used in quantitative real-time polymerase chain reaction
Figure 1 X-ray diffraction patterns of pure BNC (A) and BNC/Ag nanocomposites (1.0–16.0 wt%) (B–E), respectively.
Abbreviation: BNC, bacterial nanocellulose.
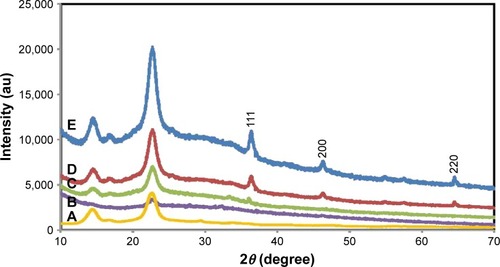
Figure 2 Fourier transform infrared spectra of (A) fruit extract, (B) pure BNC, and (C–F) BNC/Ag nanocomposites (16.0–1.0 wt%), respectively.
Abbreviation: BNC, bacterial nanocellulose.
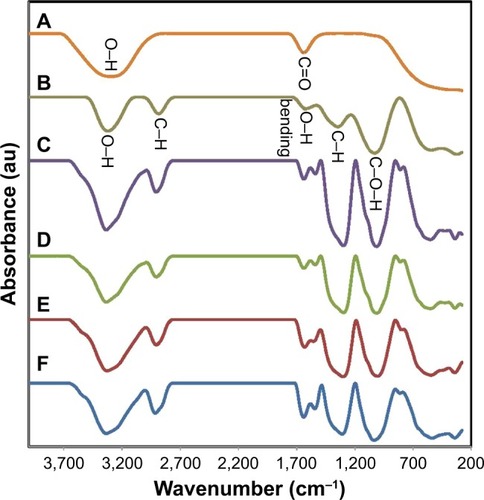
Figure 3 Field emission scanning electron microscopy images of pure (A) BNC and (B–E) BNC/Ag nanocomposites (1.0–16.0 wt%), respectively, and (inset graphs) particle size distribution of Ag-NPs.
Abbreviation: BNC, bacterial nanocellulose.
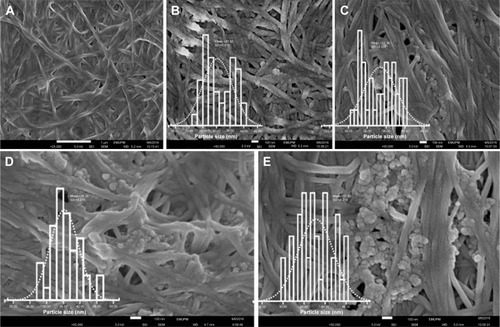
Figure 4 Swelling ratio of pure BNC (A) and BNC/Ag nanocomposites (1.0–16.0 wt%) (B–E), respectively.
Notes: The values represent the mean ± SD (n=3). **P≤0.01; ***P≤0.001; ****P≤0.0001.
Abbreviation: BNC, bacterial nanocellulose.
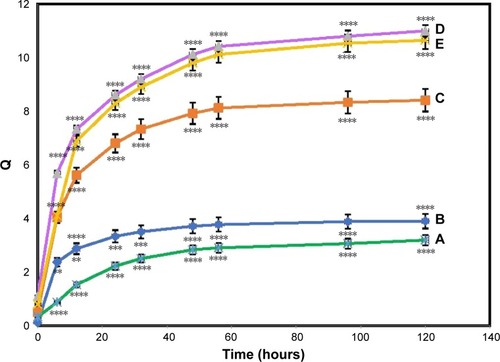
Table 2 Release quantity and release ratio of Ag from BNC/Ag nanocomposites after 1 and 4 days; slope of fitting and fitting coefficient of log (release quantity of Ag) vs log (times) curve
Figure 5 In vitro Ag releasing properties of bacterial nanocellulose/Ag nanocomposites in PBS buffer solution: (A) release quantity of Ag in PBS and (B) log (release quantity of Ag) vs log (times) curve.
Notes: The values represent the mean ± SD (n=3). ****P≤0.0001.
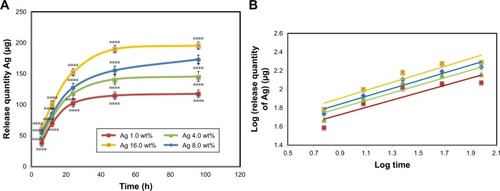
Table 3 Inhibition zones (mm) of bacterial nanocellulose/Ag nanocomposites by disk diffusion method against Gram-negative and Gram-positive bacteria
Figure 6 Effect of bacterial nanocellulose/Ag nanocomposites on the viability of human dermal fibroblast cells.
Notes: The values represent the mean ± SD (n=3). *P≤0.05; **P≤0.01; ***P≤0.001; ****P≤0.0001.
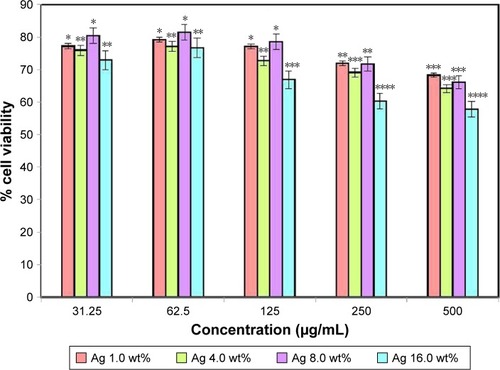
Figure 7 In vitro scratch assay.
Note: Human dermal fibroblast cells were injured and cell migration assay with and without treatment was performed at different time duration (0, 24, and 48 hours) and different concentrations of bacterial nanocellulose/Ag nanocomposites.
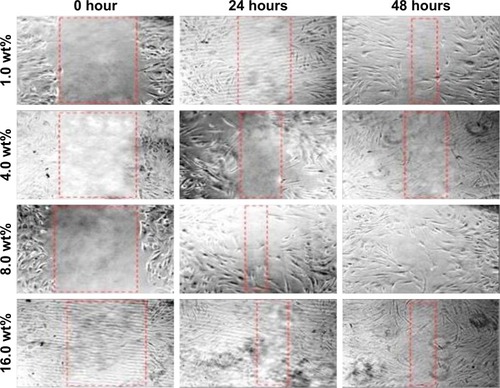
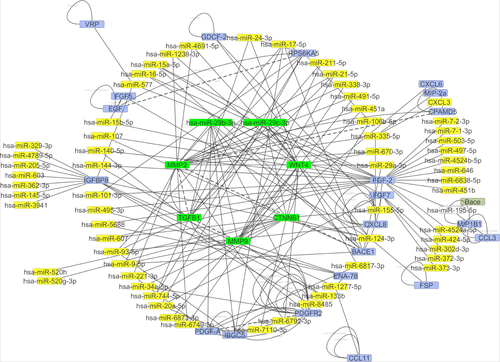
Figure 8 The network interaction analysis between has-miR-29b-3p and has-miR-29c-3p with their targets.
Note: has-miR-29b-3p and has-miR-29c-3p have strong interactions with TGF-β1, MMP2, MMP9, CTNNB1, and Wnt4 genes.
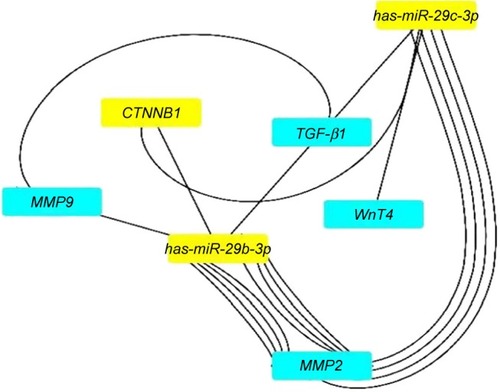
Figure 9 Gene expression analysis.
Notes: The graph shows relative fold change for the genes. The values represent the mean ± SD (n=3). **P≤0.01; ***P≤0.001; ****P≤0.0001.
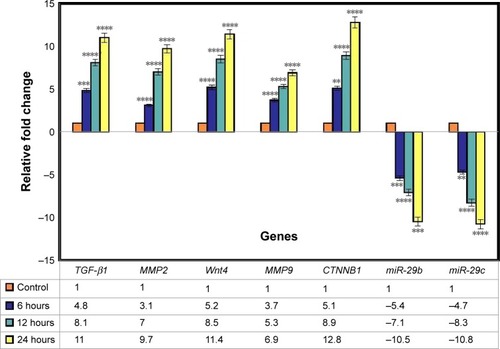
Figure S1 The effect of genes and miRNAs in wound healing process.
Notes: The gene–gene and gene–miRNAs network interaction that included 19,177 nodes and 54,573 edges. The network was mapped through Cytoscape v3.4.
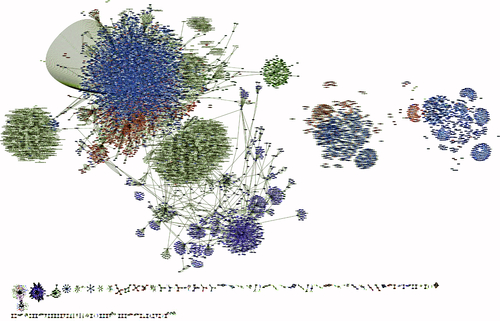
Figure S2 The interaction between genes and chemoattractions in wound healing process.
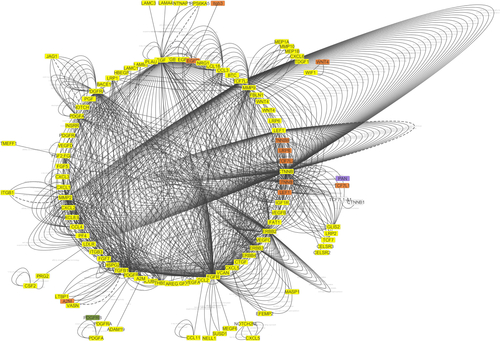
Figure S3 The interaction between gene and miRNAs. The white nodes are miRNAs and the blue ones are genes.