Figures & data
Table S1 IDH1 siRNA and scrambled siRNA sequence
Table S2 Primers used in real-time PCR for IDH1 and GAPDH
Figure 1 Schematic diagram of bubbles’ behavior and its effects on cell membranes under ultrasonic irradiation. Bubbles rapidly expand and contract and/or collapse when driven by ultrasound, and that could create voids on cell membranes.
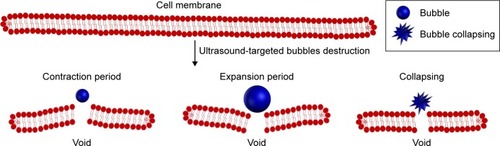
Figure 2 Schematic diagram of NBs-siRNA and its different behaviors in normal and tumor tissues. The NBs-siRNA would not penetrate the blood vessel of normal tissue; however, the reverse applied in tumor tissues. The tumor-targeted ultrasonic irradiation would break the NBs-siRNA and improve their uptake into cells.
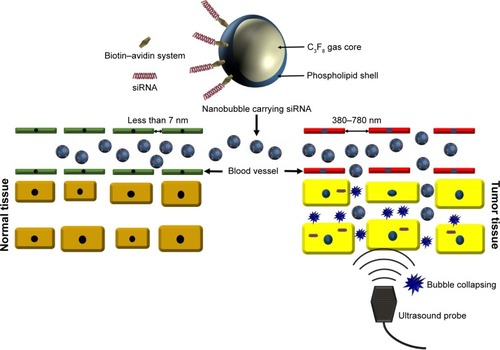
Figure 3 Characteristics of bubbles. The particle size of NBs (A) and MBs (B) measured by DLS. (C) The SEM result of NBs which are observed as hollows. (D) In vitro cytotoxicity for various phospholipid (NB’ material) concentrations determined by the CCK-8 assay. Obvious cytotoxicity appeared when the concentration reached 10 μg/mL (*P<0.05 indicates statistically significant differences compared with normal cells).
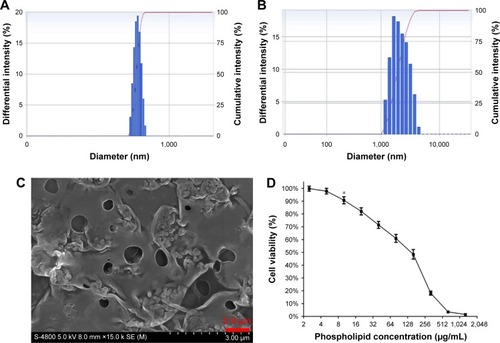
Figure 4 Characteristics of NBs-siRNA. (A) Stratification in the preparation of bubbles NBs-siRNA which is used for unlabeled siRNA removal. The diameter (B) and concentration (C) stability of NBs-siRNA at 25°C (*P<0.05, **P<0.01 were indicative of statistically significant differences compared with one minute). The optical and fluorescence images of NBs-FAM-SCR (D) and bare NBs (E).
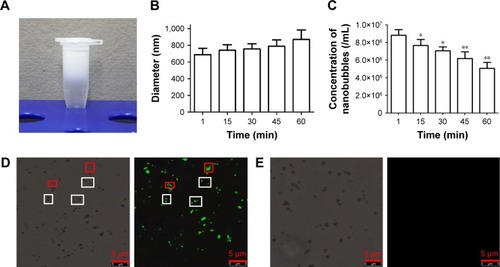
Figure 5 Laser confocal microscopic images of U87 cells of NBs-FAM-SCR-UI group and FAM-SCR-UI group. Much more green fluorescence of FAM-SCR was observed in the NBs-FAM-SCR-UI group.
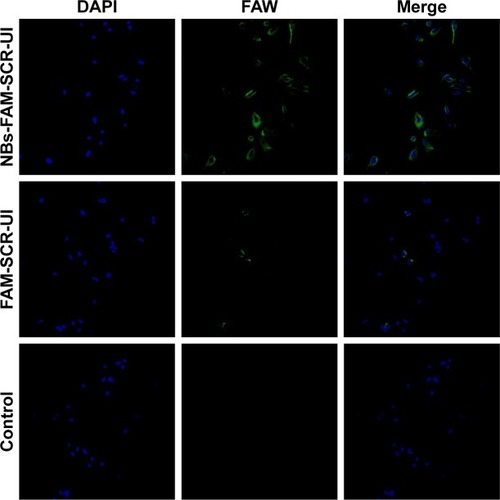
Figure 6 IDH1 gene suppression at mRNA level and protein level and its effect on cell viability and apoptosis. (A) The IDH1 gene expression at mRNA level by real-time PCR. (B) The IDH1 gene expression at protein level by Western blotting. (C) The apoptotic ratio of U87 cells quantified detected by Annexin-V flow cytometry. (D) Cell viability of U87 cells quantified by CCK-8. *P<0.05 compared with the NBs-siRNA-UI group.
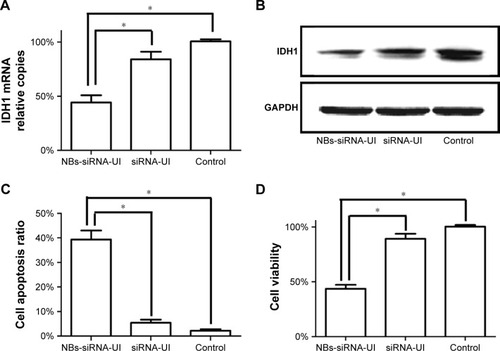
Figure 7 UI-targeted destruction effect on NBs-siRNA and NBs-siRNA distribution in tumor tissue. (A) Contrast enhancement images of NBs-siRNA with or without UI. (B) Corresponding phase-intensity curves analyzed with data extracted from (A). (C) CLSM images of frozen sections. Blue: nuclei; Green: capillary; Red: DiI-labeled NBs-siRNA. DiI-labeled NB-siRNA are observed in the intercellular space and outside the capillaries (top), whereas DiI-labeled MBs are hardly visible outside the tumor capillaries (bottom). *P<0.05.
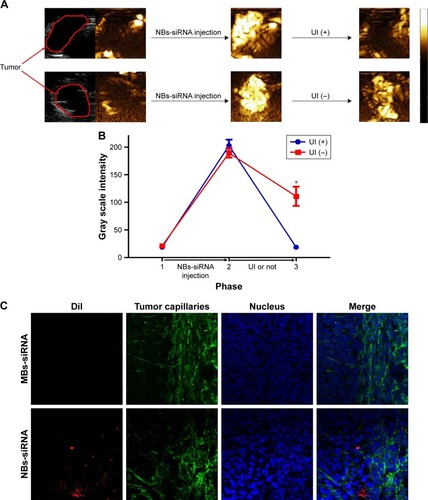
Figure 8 (A) In vitro fluorescence imaging of the tumor, liver, and spleen at different time points after DiI-labeled NBs-siRNA injection. (B) The change of fluorescence intensity of tumor, liver and spleen with time.
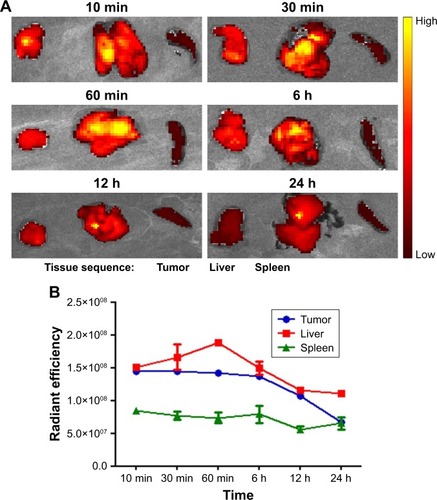
Figure 9 Tumor growth inhibition and percent survival of mice with U87 glioma in various treatment groups. (A) Tumor volume growth of each group. (B) The percent survival of mice carrying glioma receiving different treatments.
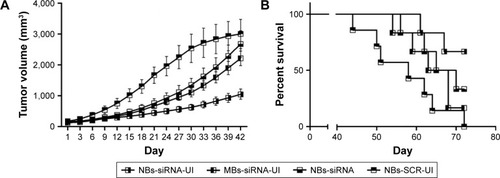
Figure 10 H&E and TUNEL assays of U87 glioma sections of tumor-bearing mice in the four different groups. (A) H&E staining: Nuclei were stained blue and cytoplasm were stained red. (B) TUNEL analyses: brown apoptotic cells were stained brown and that of normal glioma cells were blue.
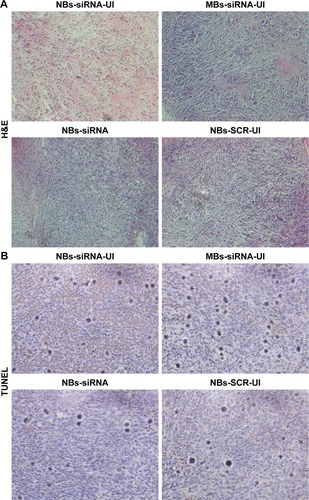
Figure S1 The average particle size of NBs-siRNA stored at 25°C for 1 (A), 15 (B), 30 (C), 45 (D), and 60 (E) min.
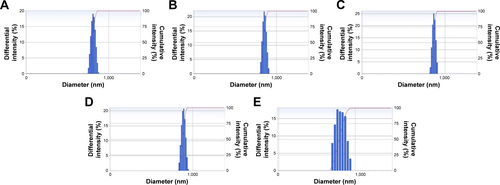
Figure S2 The percentage of apoptotic cells quantified by Annexin V and PI flow cytometry in the NBs-siRNA-UI, siRNA-UI, and control groups.
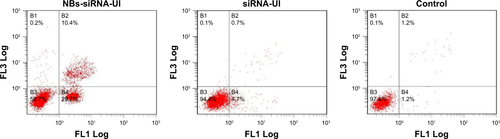
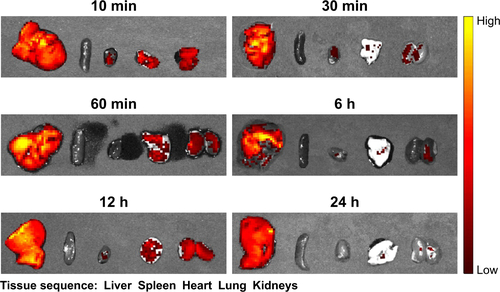
Figure S3 In vitro fluorescence imaging of tissues in healthy mice at different time points after DiI-labeled NBs-siRNA injection. The tissue sequence is liver, spleen, heart, lung, and kidneys. The liver initially showed a strong signal, whereas the spleen showed no signal.