Figures & data
Table 1 Inhibitors used in the study of cell uptake mechanism
Figure 1 FTIR spectra (A and B), Raman spectra (C and D), TGA curves (E and F), concentration of carboxyl group (G), and content of metal impurities (H and I) of MWCNTs and GRAPHENE before and after oxidation.
Abbreviations: FTIR, Fourier transform infrared; TGA, thermogravimetric analysis; MWCNTs, multi-walled carbon nanotubes.
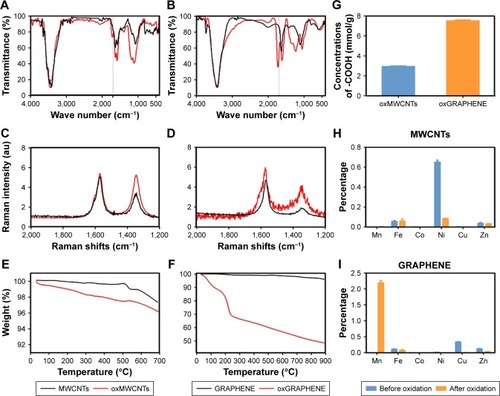
Figure 2 Appearance of oxMWCNT and oxGRAPHENE dispersions (25 μg/mL) (A). (B) Size distribution of the nanocarbon dispersion. (C) TEM images of MWCNTs and GRAPHENE before and after oxidation. The nanoparticle suspension after ultrasonic dispersion of oxMWCNTs and oxGRAPHENE was also indicated in the last line.
Abbreviations: MWCNTs, multi-walled carbon nanotubes; TEM, transmission electron microscopy.
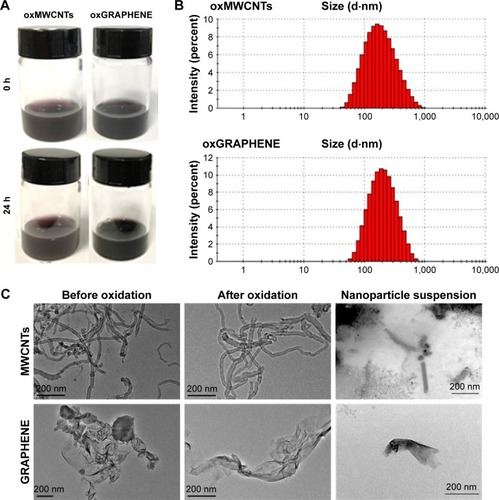
Figure 3 The viability of A549 cells and Caco-2 cells treated with oxMWCNTs or oxGRAPHENE. According to the LDH assay the dispersion of oxMWCNTs and oxGRAPHENE showed no significant cytotoxicity in A549 cell line and Caco-2 cell line when the concentration was below 100 μg/mL.
Note: (A, B) The viability of A549 cells with oxMWCNTs and oxGRAPHENE. (C, D) The viability of Caco-2 cells with oxMWCNTs and oxGRAPHENE.
Abbreviation: MWCNTs, multi-walled carbon nanotubes.
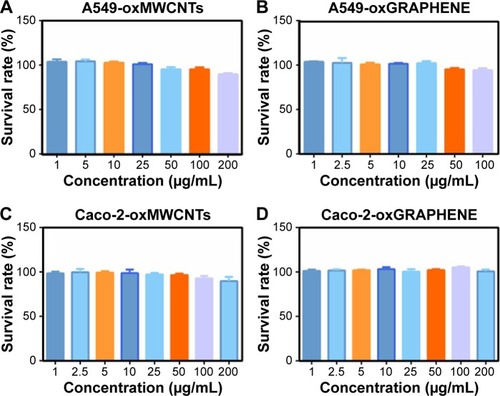
Figure 4 The qPCR and Western blot analysis of Cdc42, Rac1, and RhoA in A549 cells (A) and Caco-2 cells (B). Immunofluorescence analyses of the expression of Cdc42, Rac1, and RhoA in A549 cells and Caco-2 cells (C). Scale bar =50 μm.
Abbreviation: NC, negative control.
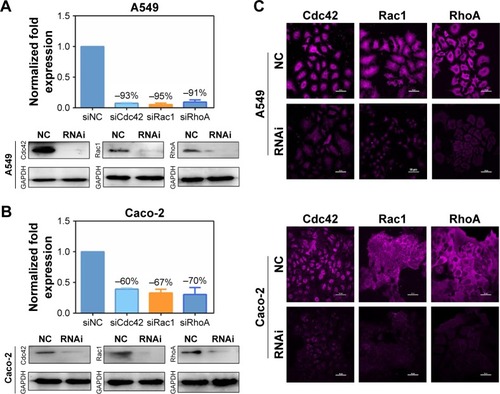
Figure 5 The endocytosis of oxMWCNTs and oxGRAPHENE in A549 cells after down-regulation of Cdc42, Rac1, and RhoA. The carbon nanomaterials (green) were detected by reflected signals. (A–D) CLSM images of endocytosis and relative cellular uptake of oxMWCNTs or oxGRAPHENE in wild and Rho GTPase-silenced A549 cells. (E–H) The endocytosis of oxMWCNTs and oxGRAPHENE in A549 cells after inactivation of Cdc42, Rac1, and RhoA. Data were expressed as mean ± SE, n (indicates different cells) ≥30 (*P<0.05; ***P<0.001).
Abbreviations: MWCNTs, multi-walled carbon nanotubes; CLSM, confocal laser scanning microscopy; NC, negative control.
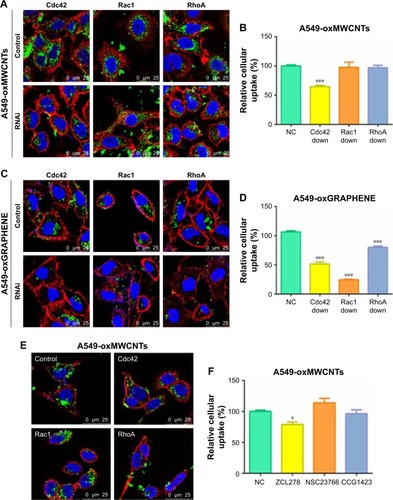
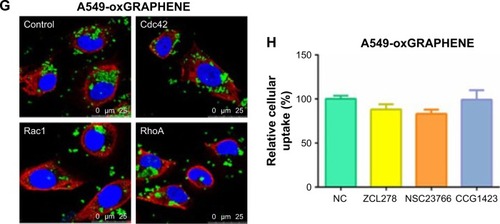
Figure 6 The endocytosis of oxMWCNTs and oxGRAPHENE in Caco-2 cells after down-regulation of Cdc42, Rac1, and RhoA. (A–D) CLSM images of endocytosis and relative cellular uptake of oxMWCNTs or oxGRAPHENE in wild and Rho GTPase-silenced Caco-2 cells. (E–H) CLSM images of endocytosis and relative cellular uptake of oxMWCNTs or oxGRAPHENE in Caco-2 cells after inactivation of Cdc42, Rac1, and RhoA. Data were expressed as mean ± SE, n (indicates different cells) ≥30 (*P<0.05; ***P<0.001).
Abbreviations: MWCNTs, multi-walled carbon nanotubes; CLSM, confocal laser scanning microscopy; NC, negative control.
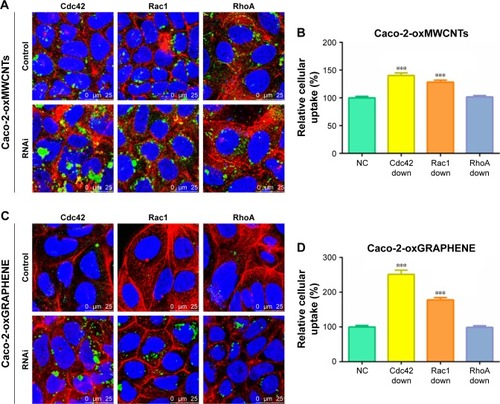
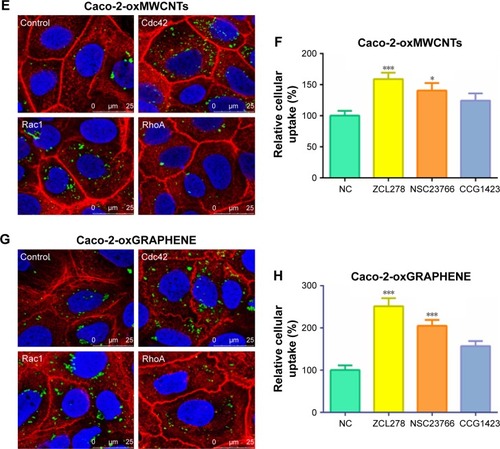
Figure 7 The viability of A549 cells and Caco-2 cells treated with inhibitors (A, B). The designated concentration of inhibitors showed no significant cytotoxicity in the two cell lines. The relative intracellular amount of oxMWCNTs in A549 cells (C), oxGRAPHENE in A549 cells (D), oxMWCNTs in Caco-2 cells (E), and oxGRAPHENE in Caco-2 cells (F) after blocking certain endocytic pathways. Data were expressed as mean ± SE, n≥30 (*P<0.05; **P<0.01; ***P<0.001).
Abbreviations: MWCNTs, multi-walled carbon nanotubes; NC, negative control.
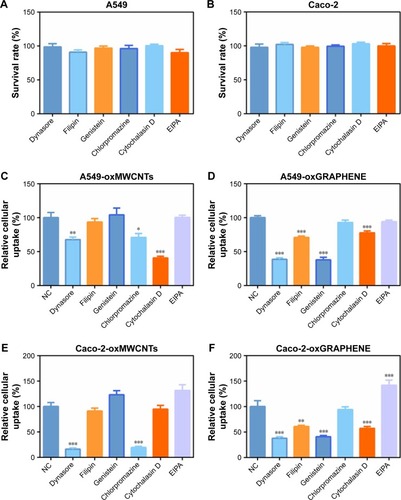
Figure 8 TEM images of oxMWCNTs and oxGRAPHENE in A549 cells (A) and Caco-2 cells (B). The red arrows refer to the oxMWCNTs penetrating the lysosomal membrane of A549 cells and Caco-2 cells. Yellow arrows refer to the movement direction of vesicles. Blue arrows refer to the microvilli structures of Caco-2 cells.
Abbreviations: TEM, transmission electron microscopy; MWCNTs, multi-walled carbon nanotubes.
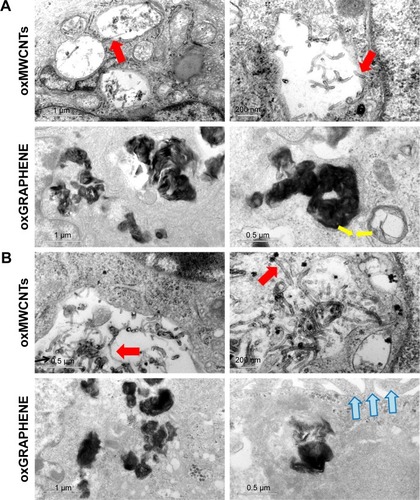
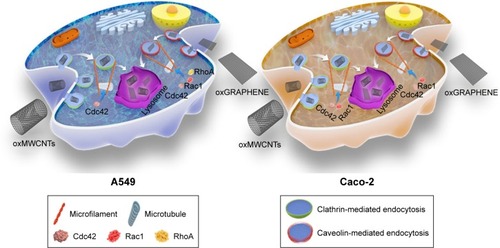
Figure 9 A schematic representation of oxMWCNTs and oxGRAPHENE endocytic pathways in A549 and Caco-2 cells.
Abbreviation: MWCNTs, multi-walled carbon nanotubes.