Figures & data
Figure 1 Electron microscopy characterization of rGO–Ag nanocomposite.
Notes: (A) SEM image of GO. (B) SEM image of rGO–Ag nanocomposite. (C) TEM image of GO. (D) TEM image of rGO–Ag nanocomposite. (E) EDX spectrum recorded showing sharp peak between 0 and 0.5 keV and 2.7 and 4 keV confirming the presence of carbon (graphene) and silver, respectively. (F) Frequency (%) of Ag nanoparticle size distribution.
Abbreviations: At, atomic; EDX, energy-dispersive X-ray; rGO–Ag, silver-doped reduced graphene oxide; rGO–Ag, silver-doped reduced graphene oxide; SEM, scanning electron microscope; TEM, transmission electron microscope.
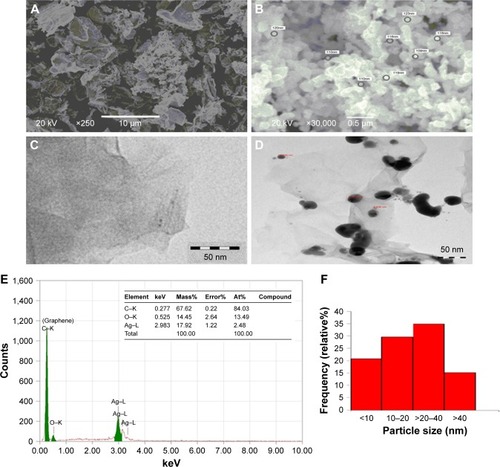
Figure 2 Morphological changes in CHANG and HepG2 cells exposed to different concentrations of rGO–Ag nanocomposite for 24 h. Scale bar=50 µm.
Abbreviation: rGO–Ag, silver-doped reduced graphene oxide.
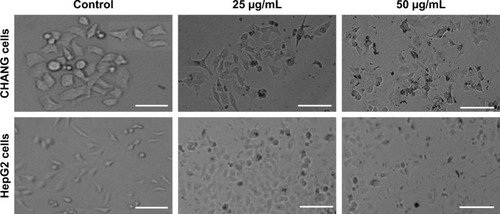
Figure 3 Cytotoxicity of rGO–Ag nanocomposite in CHANG and HepG2 cells for 24 h, as determined by (A) MTT and (B) LDH tests. Each value represents the mean±SE of three experiments. n=3, *p<0.05 and **p<0.01 vs control. A significant positive correlation between the LDH leakage and MTT cell viability in CHANG cells (C) and HepG2 cells (D) after rGO–Ag nanocomposite exposure.
Abbreviations: rGO–Ag, silver-doped reduced graphene oxide; LDH, lactate dehydrogenase; SE, standard error.
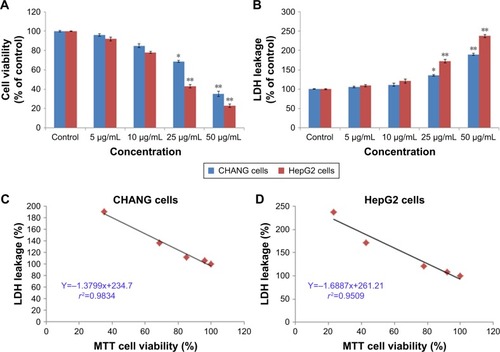
Figure 4 ROS production induced by rGO–Ag nanocomposite.
Notes: (A) The fluorescence image of CHANG and HepG2 cells treated with 50 µg/mL of rGO–Ag nanocomposite for 24 h and stained with DCFH-DA. (B) % ROS production due to rGO–Ag nanocomposite in cells. CHANG and HepG2 cells were pretreated with NAC (1.2 mM) for 1 h and then exposed to rGO–Ag nanocomposite (50 µg/mL) for 24 h. Each value represents the mean±SE of three experiments. *p<0.05 and **p<0.01 vs control. #p<0.05 and ##p<0.01 vs control and rGO–Ag nanocomposite (50 µg/mL).
Abbreviations: DCFH-DA, 2,7-dichlorofluoresceindiacetate; rGO–Ag, silver-doped reduced graphene oxide; NAC, N-acetylcysteine; ROS, reactive oxygen species; SE, standard error.
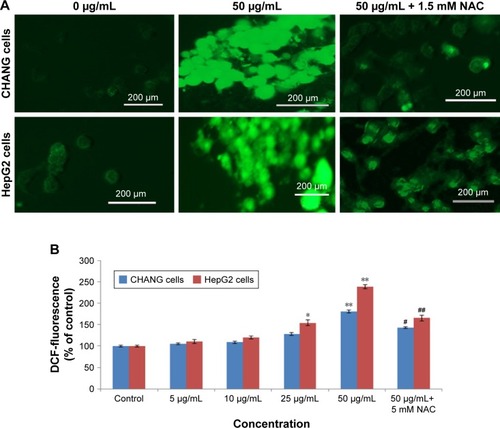
Figure 5 (A) Levels of LPO, (B) GSH, and (C) SOD. (D) Catalase activity in CHANG and HepG2 cells after exposure to rGO–Ag nanocomposite for 24 h.
Notes: Each value represents the mean±SE of three experiments. *p<0.05 and **p<0.01 vs control.
Abbreviations: rGO–Ag, silver-doped reduced graphene oxide; GSH, glutathione; LPO, lipid peroxide; MDA, malondialdehyde; SE, standard error; SOD, superoxide dismutase.
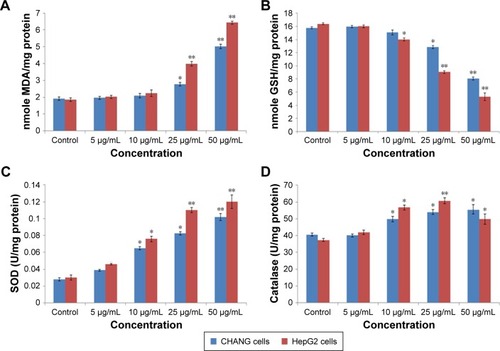
Figure 6 Images representing MMP loss in CHANG and HepG2 cells after rGO–Ag nanocomposite exposure at concentrations of 25 and 50 µg/mL for 24 h.
Notes: (A) Control cells. (B) rGO–Ag nanocomposite exposure, 25 µg/mL for 24 h and (C) 50 µg/mL for 24 h. (D) Change in MMP (%) in CHANG and HepG2 cells after rGO–Ag nanocomposite exposure for 24 h. Each value represents the mean±SE of three experiments. *p<0.05 and **p<0.01 vs control.
Abbreviations: rGO–Ag, silver-doped reduced graphene oxide; MMP, mitochondrial membrane potential; SE, standard error.
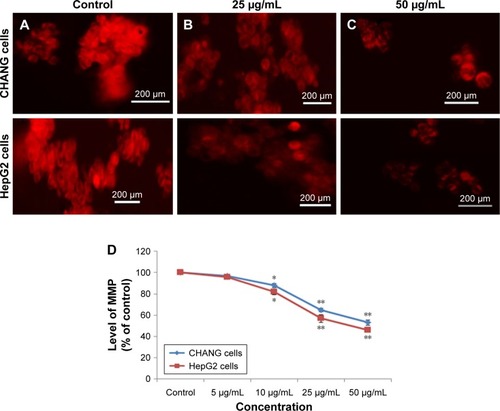
Figure 7 (A) Chromosomal condensation and (B) induction of caspase-3 activity in CHANG and HepG2 cells after exposure to rGO–Ag nanocomposite for 24 h.
Notes: Each value represents the mean±SE of three experiments. *p<0.05 and **p<0.01 vs control. Arrows indicate fragmented chromosome.
Abbreviations: rGO–Ag, silver-doped reduced graphene oxide; SE, standard error.
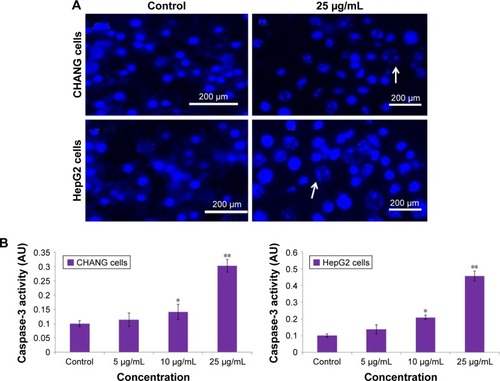
Figure 8 rGO–Ag nanocomposite (25 µg/mL) induced apoptosis and necrosis in CHANG and HepG2 cells.
Notes: Annexin V-FITC and PI fluorescence were measured using flow cytometer with PI and Annexin V-FITC filters, respectively. (A) Control (CHANG cells). (B) rGO–Ag nanocomposite (25 µg/mL)-exposed CHANG cells. (C) Control (HepG2 cells). (D) rGO–Ag nanocomposite (25 µg/mL)-exposed HepG2 cells. (E) Percentage of apoptotic and necrotic CHANG and HepG2 cells at rGO–Ag nanocomposite (25 µg/mL) exposure. Q3, living cells (Annexin V−/PI−); Q4, primary apoptotic cells (Annexin V+/PI−); Q2, late apoptotic and secondary apoptotic cells (Annexin V+/PI+); Q1, necrotic cells (Annexin V−/PI+). Data represent average±SE of triplicate experiments. *p<0.05 and **p<0.01 compared to control.
Abbreviations: rGO–Ag, silver-doped reduced graphene oxide; PI, propidium iodide; SE, standard error.
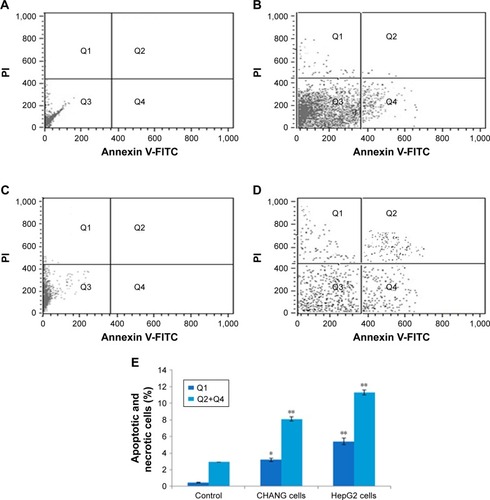
Figure 9 Quantitative real-time PCR analysis of mRNA levels of apoptotic genes in CHANG and HepG2 cells exposed to rGO–Ag nanocomposite for 24 h.
Notes: Results are expressed as average±SE of triplicate experiments. *p<0.05 and **p<0.01 compared to control.
Abbreviations: rGO–Ag, silver-doped reduced graphene oxide; PCR, polymerase chain reaction; SE, standard error.
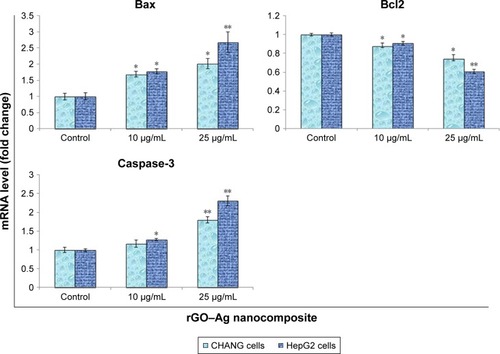
Figure 10 DNA strand breakage in CHANG and HepG2 cells due to the rGO–Ag nanocomposite.
Notes: (A) Tail DNA (%). (B) Olive tail moment. (C) Untreated (CHANG) cell. (D) Treated CHANG cell (25 µg/mL of rGO–Ag nanocomposite). (E) Untreated (HepG2) cell. (F) Treated HepG2 cell (25 µg/mL of rGO–Ag nanocomposite). Each value represents the mean±SE of three experiments. *p<0.05 and **p<0.01 vs control. Scale bar =50 µm.
Abbreviations: rGO–Ag, silver-doped reduced graphene oxide; SE, standard error.
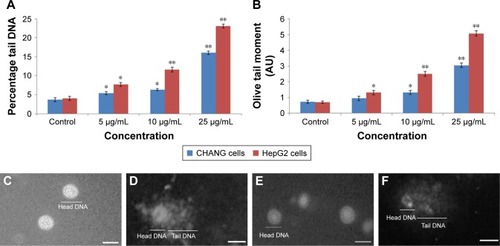
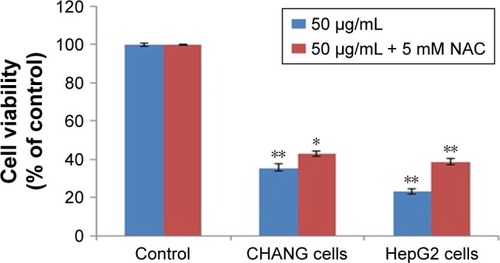
Figure 11 CHANG and HepG2 cells were exposed to rGO–Ag nanocomposite (50 µg/mL) in the presence of 5 mM NAC for 24 h.
Notes: NAC significantly reversed the viability (MTT assay) of CHANG and HepG2 cells caused by the rGO–Ag nanocomposite. Each value represents the mean±SE of three experiments. n=3, *p<0.05 and **p<0.01 vs control.
Abbreviations: rGO–Ag, silver-doped reduced graphene oxide; NAC, N-acetyl-cysteine; SE, standard error.