Figures & data
Table 1 Size (hydrodynamic diameter), Z potential, and emission peaks of green and rQDs-GSH
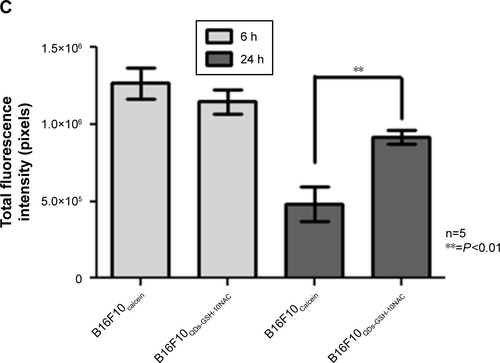
Figure 1 B16F10 cells viability after rQDs-GSH and gQDs-GSH incorporation.
Notes: (A) Dot plot of B16F10 cells labeled with gQDs-GSH or rQDs-GSH (100 μg/mL), and B16F10 control cells. Events were gated to show B16F10 gQDs-GSH+ or rQDs-GSH+ cells and live or dead B16F10 cells. (B) Effects on B16F10 cell viability of treatments with lipofectamine and gQDS-GSH or rQDs-GSH. (C) Comparison of viable labeled cells treated with either rQDs-GSH or gQDs-GSH, and lipofectamine. (D) Comparison of MFI associated with either rQDs-GSH or gQDs-GSH in viable B16F10 cells. Results were averaged from 3 to 4 independent experiments (n=3–4). Data were analyzed using the nonparametric Mann–Whitney test. Statistically significant differences compared with the controls and different treatments are indicated.
Abbreviations: GSH, glutathione; gQDs-GSH, green QDs-GSH; MFI, mean fluorescence intensity; QDs, quantum dots; rQDs-GSH, red QDs-GSH.
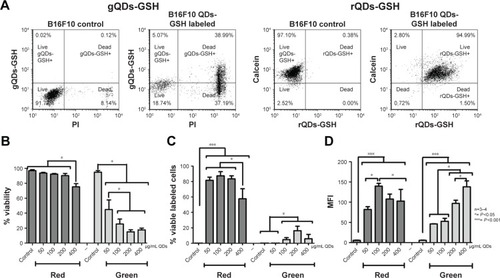
Figure 2 Effects of NAC treatment on ROS levels, viability, and incorporation of rQDs-GSH into B16F10 cells.
Notes: (A) Schematic summarizing the labeling assays in the presence of NAC. (B) Dot plot of B16F10 cells labeled with H2DCFDA or rQDs-GSH (100 μg/mL) and B16F10 control cells. Events were gated to show B16F10 H2DCFDA+ or rQDs-GSH+ B16F10 cells. (C) Confocal imaging of viable B16F10 cells (Calcein labeled) with or without rQDs-GSH. (D) ROS levels of B16F10 cells labeled with 100 μg/mL of rQDs-GSH in the presence of 0, 4, or 10 mM NAC during the labeling process. (E) Percentage of viable rQDs-GSH-labeled B16F10 cells in the presence of different NAC concentrations. (F) MFI associated with QDs-GSH fluorescence in viable rQDs-GSH-labeled B16F10 cells in the presence of different NAC concentrations. Results were averaged from 3 to 6 independent experiments (n=3–6). Data were analyzed using the nonparametric Mann–Whitney test. Statistically significant differences compared with the controls and different treatments are indicated.
Abbreviations: GSH, glutathione; H2DCFDA, dichlorodihydrofluorescein; hrs, hours; MFI, mean fluorescence intensity; NAC, N-acetylcysteine; QDs, quantum dots; rQDs-GSH, red QDs-GSH.
Figure 3 Migration and invasion of B16F10 cells labeled with rQDs-GSH in the presence of NAC.
Notes: (A) Images obtained by epifluorescence optical microscopy of migratory B16F10 control, B16F10QDs-GSH-4NAC, and B16F10QDs-GSH-4NAC cells. In circles, migratory cells; white arrows: fluorescent cells; black arrows: migratory rQDs-GSH-labeled cells. (B) Quantification of the migration of B16F10QDs-GSH-4NAC, B16F10QDs-GSH-10NAC, and control cells. (C) Images obtained by epifluorescence optical microscopy of invading B16F10 control, B16F10QDs-GSH-4NAC, and B16F10QDs-GSH-4NAC cells. In circles, migratory cells; white arrows: fluorescent cells; black arrows: migratory rQDs-GSH-labeled cells. (D) Confocal microscopy of invading B16F10QDs-GSH-4NAC and B16F10 cells. (E) Quantification of the invasiveness of B16F10QDs-GSH-4NAC, B16F10QDs-GSH-10NAC, and control cells. Results were averaged from three independent experiments (n=3). Data were analyzed using the nonparametric Mann–Whitney test. Statistically significant differences compared with the controls and different treatments are indicated.
Abbreviations: B16F10QDs-GSH-4NAC, B16F10 cells labeled with rQDs-GSHin presence of 4 mM of NAC; B16F10QDs-GSH-10NAC, B16F10 cells labeled with rQDs-GSH in presence of 10 mM of NAC; GSH, glutathione; NAC, N-acetylcysteine; QDs, quantum dots; rQDs-GSH, red QDs-GSH.
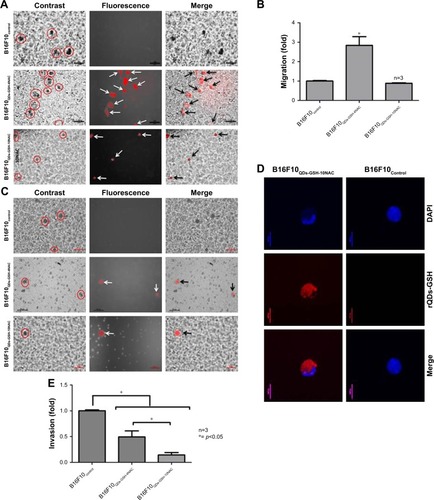
Figure 4 Effects of QDs-GSH labeling on B16F10 cell proliferation and QDs-GSH signal persistence.
Notes: (A) B16F10QDs-GSH-10NAC and control cell viability. (B) Percentage of viable B16F10QDs-GSH-10NAC cells. (C) MFI of viable B16F10QDs-GSH-10NAC cells. (D) Total number of B16F10QDs-GSH-10NAC cells. Results were obtained over a 5-day period after labeling and averaged from 3 to 6 independent experiments (n=3–6). Data were analyzed using the nonparametric Mann–Whitney test. Statistically significant differences compared with the controls and different treatments are indicated.
Abbreviations: B16F10QDs-GSH-10NAC, B16F10 cells labeled with rQDs-GSH in presence of 10 mM of NAC; GSH, glutathione; MFI, mean fluorescence intensity; NAC, N-acetylcysteine; QDs, quantum dots; rQDs-GSH, red QDs-GSH.
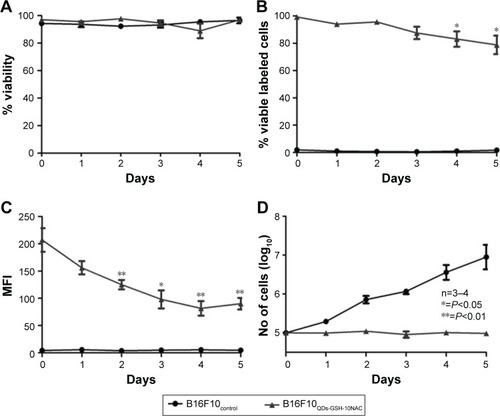
Figure 5 In vivo metastasis assays using rQDs-GSH-labeled B16F10 cells.
Notes: B16F10QDs-GSH-10NAC and control cells were injected into the tail vein of C57BL/6 mice. After 21 days, mice were sacrificed and lungs were collected. (A) Scheme summarizing the time course of metastasis assays. (B) C57BL/6 mouse survival up to 21 days post-injection of B16F10 (dashed line) or B16F10QDs-GSH-10NAC (solid line) cells. (C) Determination of tumor mass present in lungs from C57BL/6 mice at 21 days post-injection of B16F10 control or B16F10QDs-GSH-10NAC cells. Results were averaged from
8 (B16F10 control cells) or 12 (B16F10QDs-GSH-10NAC cells) independent experiments in mice (n=8–12). Data were analyzed using the nonparametric Mann–Whitney test. Statistically significant differences compared with the controls and different treatments are indicated. Note that the data shown were obtained in a double-blind study.
Abbreviations: B16F10QDs-GSH-10NAC, B16F10 cells labeled with rQDs-GSH in presence of 10 mM of NAC; GSH, glutathione; NAC, N-acetylcysteine; QDs, quantum dots; rQDs-GSH, red QDs-GSH.
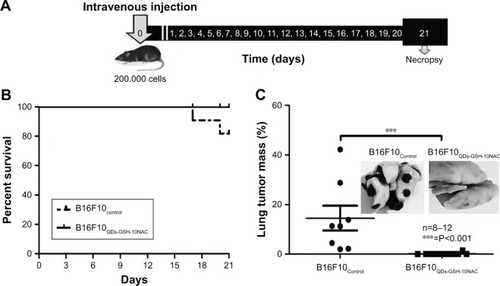
Figure 6 In vivo B16F10QDs-GSH-10NAC cell tracking.
Notes: B16F10QDs-GSH-10NAC cells were injected into the tail vein of C57BL/6 mice. rQDs-GSH signals were followed and quantified by imaging the signal in lungs. Organs were collected at 5 minutes, 30 minutes, 2 hours, 6 hours, and 24 hours post-injection. (A) A scheme summarizing the time course of early metastasis assays. (B) Eppendorf tubes containing B16F10control and B16F10QDs-GSH-10NAC cells used for injection in C57BL/6 mice. (C) Image showing lungs collected from C57BL/6 mice 6 hours post-injection with either control or labeled cells (duplicate). (D) Fluorescence images of lungs collected from C57BL/6 mice 6 hours post-injection with either control or labeled cells. (E–J) Quantification of rQDs-GSH-associated fluorescence in lungs, heart, kidneys, liver, spleen, and thymus of C57BL/6 mice at different time points after injection of B16F10control or B16F10QDs-GSH-10NAC cells. Results were averaged from 12 independent experiments (n=12) for lung, heart, kidney, liver, spleen, and 4–10 independent experiments (n=4–10) for thymus. Data were analyzed using the nonparametric Mann–Whitney test. Statistically significant differences compared with the controls and different treatments are indicated. Note that the data shown were obtained in a double-blind study.
Abbreviations: B16F10QDs-GSH-10NAC, B16F10 cells labeled with rQDs-GSH in presence of 10 mM of NAC; GSH, glutathione; IVIS, in vivo imaging system; NAC, N-acetylcysteine; QDs, quantum dots; rQDs-GSH, red QDs-GSH.
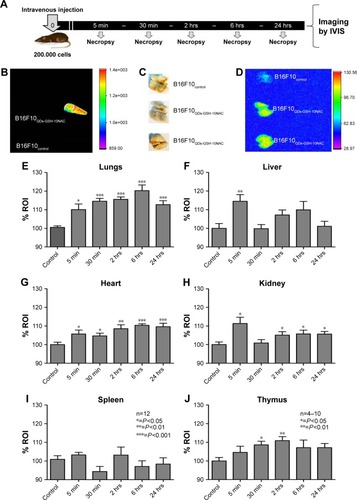
Figure 7 Presence and distribution of B16F10QDs-GSH-10NAC and B16F10Calcein cells in the lungs of C57BL/6 mice.
Notes: B16F10QDs-GSH-10NAC, B16F10Calcein, and control cells were injected into the tail vein of C57BL/6 mice. Fluorescence signals due to either rQDs-GSH or Calcein were determined in lungs at 6 and 24 hours post-injection. (A) Confocal images of histological sections from lungs collected at 6 hours post-injection of B16F10QDs-GSH-10NAC or B16F10Control cells. (B) Confocal images of histological sections from lungs collected at 6 hours post-injection of B16F10QDs-GSH-10NAC or B16F10Calcein cells. (C) Confocal images of histological sections from lungs collected at 24 hours post-injection of B16F10QDs-GSH-10NAC or B16F10Calcein cells. White arrows show fluorescence due to presence of B16F10QDs-GSH-10NAC or B16F10Calcein cells. Note that the data shown were obtained in a double-blind study.
Abbreviations: B16F10QDs-GSH-10NAC, B16F10 cells labeled with rQDs-GSH in presence of 10 mM of NAC; GSH, glutathione; NAC, N-acetylcysteine; QDs, quantum dots; rQDs-GSH, red QDs-GSH.
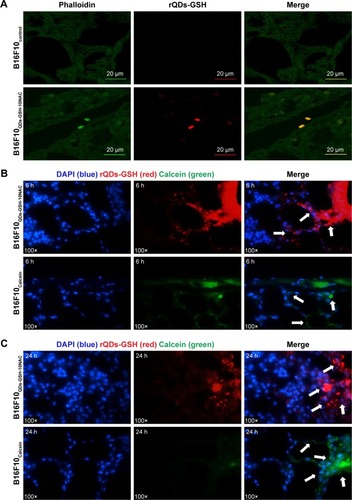
Figure 8 Proof-of-concept experiment to evaluate the effect of CAV1 expression in labeled B16F10 cells following injection into C57BL/6 mice.
Notes: B16F10(Mock) and B16F10(CAV-1) cells were labeled with rQDs-GSH and used in this proof-of-concept experiment. (A) Schematic summarizing the labeling assays of B16F10(Mock) or B16F10(CAV-1) cells used in proof of concept. (B) Total viability of B16F10(Mock) and B16F10(CAV-1) cells after labeling with rQDs-GSH. (C) Viability rQDs-GSH-labeled B16F10(Mock) and B16F10(CAV-1) cells. (D) MFI of viable rQDs-GSH-labeled B16F10(Mock) and B16F10(CAV-1) cells. (E) In vivo imaging of lungs collected from C57BL/6 mice 6 hours post-injection with viable rQDs-GSH-labeled B16F10(Mock) and B16F10(CAV-1) cells. Results were averaged from three independent experiments (n=3). Data were analyzed using the nonparametric Mann–Whitney test. Treated cells that did not show statistically significant differences are indicated. Note that the data shown were obtained in a double-blind study.
Abbreviations: CAV-1, Caveolin-1; GSH, glutathione; MFI, mean fluorescence intensity; QDs, quantum dots; rQDs-GSH, red QDs-GSH.
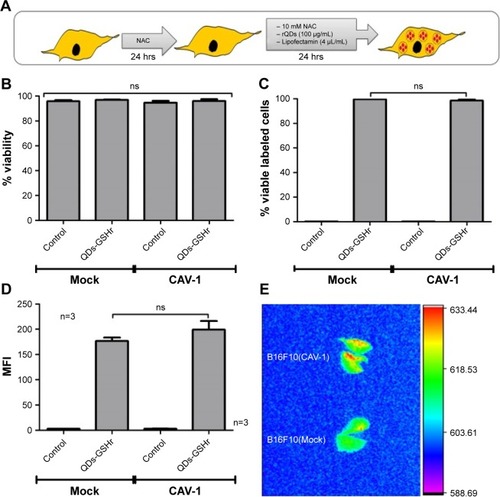
Figure S1 TEM image of rQDs-GSH.
Notes: rQDs-GSH were observed by TEM microscopy and the core size was determined using ImageJ software. (A) TEM image of rQDs-GSH. (B) A threefold amplification of square shown in image A. (C) Quantification of electron-dense granule size (core of rQDs-GSH).
Abbreviations: GSH, glutathione; QDs, quantum dots; rQDs-GSH, red QDs-GSH; TEM, transmission electron microscopy.
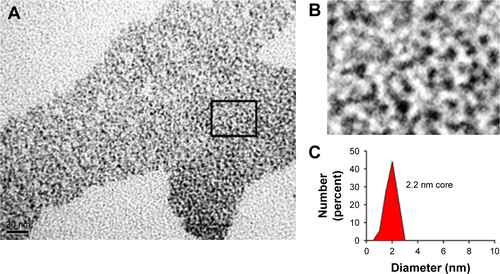
Figure S2 Intracellular reduced thiol levels in MKN45 and B16F10 cells.
Notes: Intracellular RSH levels in MKN45 and B16F10 cells were measured by Ellman’s assay. Results were averaged from three independent experiments (n=3). Data were analyzed using the nonparametric Mann–Whitney test. Statistically significant differences are indicated.
Abbreviation: RSH, reduced thiols.
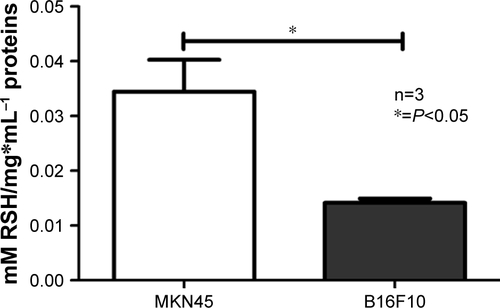
Figure S3 Effects of QDs-GSH incorporation on B16F10 cell proliferation and evaluation of QDs-GSH signal after 24 hours.
Notes: 1×10⁵ B16F10 cells (white bars) and B16F10 cells labeled with rQDs-GSH (gray bars) were cultured in RPMI supplemented with 10% FBS for 24 hours, and cell viability, percentage of viable labeled cells, MFI, and the total cell number (quantification of proliferation) were determined after cell labeling. (A) Cell viability at 0 or 24 hours post-labeling. (B) Percentage of viable B16F10 cells at 0 or 24 hours post-labeling. (C) MFI of viable B16F10 cells at 0 or 24 hours post-labeling. (D) Total number of B16F10 cells at 0 or 24 hours post-labeling. Results were averaged from three independent experiments (n=3). Data were analyzed using the nonparametric Mann–Whitney test. The n.s. significant differences compared with the controls and different treatments are indicated.
Abbreviations: GSH, glutathione; MFI, mean fluorescence intensity; n.s., non-statistically; QDs, quantum dots; rQDs-GSH, red QDs-GSH.
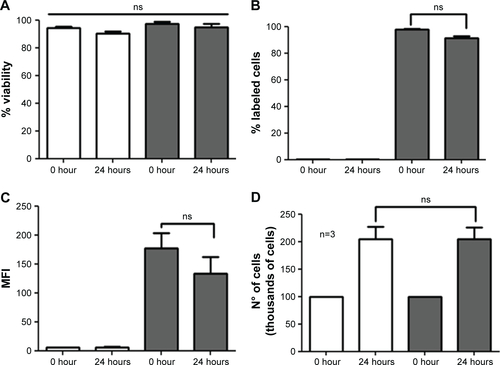
Figure S4 In vivo imaging of C57BL/6 mice treated with B16F10QDs-GSH-10NAC and B16F10 control cells.
Notes: B16F10QDs-GSH-10NAC (1 and 3) and B16F10 control cells (2) were injected into C57BL/6 mice. Fluorescence signals for rQDs-GSH were followed in mice for 6 hours. Imaging shows no differences in fluorescence signals between the mice.
Abbreviations: B16F10QDs-GSH-10NAC, B16F10 cells labeled with rQDs-GSH in presence of 10 mM of NAC; GSH, glutathione; MFI, mean fluorescence intensity; NAC, N-acetylcysteine; QDs, quantum dots; rQDs-GSH, red QDs-GSH.
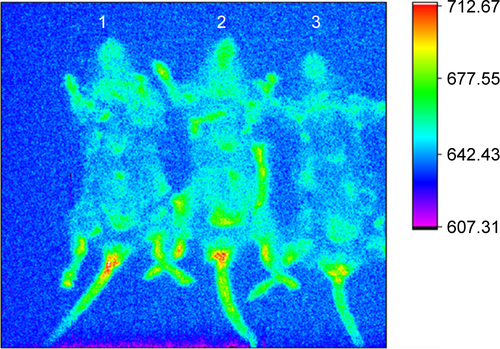
Figure S5 Controls of histological assays: fluorescence signals due to rQDs-GSH or Calcein were followed in lungs 6 hours post-injection of unlabeled B16F10 cells. Notes: (A) Light microcopy images of histological sections from lungs collected 6 hours post-injection of unlabeled B16F10 cells and stained with hematoxylin and eosin. Images show various tissue areas where B16F10 cells were identified. (B) Confocal images of histological sections from lungs collected 6 hours post-injection of unlabeled B16F10 cells. Phalloidin green, red, and DAPI were used as a contrast media. No signals related to rQDs-GSH or Calcein were observed.
Abbreviations: GSH, glutathione; QDs, quantum dots; rQDs-GSH, red QDs-GSH.
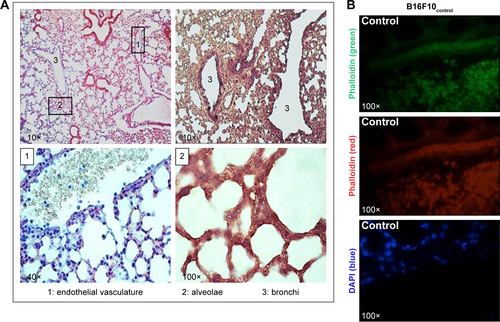
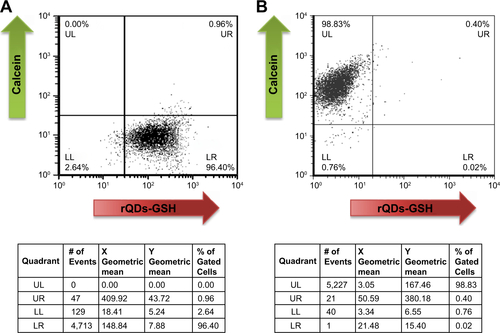
Figure S6 Fluorescence intensity of B16F10QDs-GSH-10NAC and B16F10Calcein cells at 6 and 24 hours post-injection: dot plot obtained by flow cytometry and the respective quantification of mean fluorescence intensity in each quadrant.
Notes: (A) B16F10QDs-GSH-10NAC cells. (B) B16F10Calcein cells. (C) Fluorescence due to the presence of B16F10QDs-GSH-10NAC and B16F10Calcein cells in histological slices was measured with ImageJ 1.47 v software (National Institutes of Health, USA). Results were averaged from five independent experiments (n=5). Data were analyzed using the nonparametric Mann–Whitney test. Statistically significant differences are indicated.
Abbreviations: B16F10QDs-GSH-10NAC, B16F10 cells labeled with rQDs-GSH in presence of 10 mM of NAC; GSH, glutathione; NAC, N-acetylcysteine; QDs, quantum dots; rQDs-GSH, red QDs-GSH.