Figures & data
Figure 1 Animal surgery procedure.
Notes: (A) Partial-thickness Achilles tendon of one hindlimb was harvested. (B) The bone tunnel was made in the proximal tibia of the other hindlimb. (C, D) The Achilles tendon graft was passed through the bone tunnel.
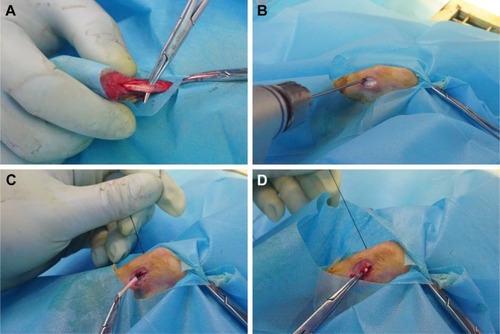
Figure 2 SEM observations of the dual-layer aligned-random nanofibrous scaffold.
Notes: (A) Cross-section of the scaffold; (B) upper layer of aligned fibers; and (C) lower layer of random fibers.
Abbreviation: SEM, scanning electron microscopy.
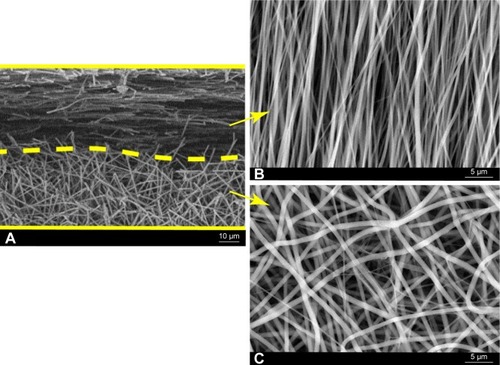
Figure 3 Histological characterization of the control group, the RS group, and the ARS group at 6 and 12 weeks after surgery.
Notes: (A) TB staining and (C) H&E staining evaluation of the tendon–bone interface at 6 weeks after surgery. (B) Metachromasia analysis with TB-stained slides. Higer level of metachromasia indicates more mature fibrocartilage. (D) Interface width analysis with H&E-stained slides. *P<0.05 vs control, #P<0.05 vs RS group. Smaller interface width indicates better osteointegration to the tendon.
Abbreviations: B, bone; IF, interface; T, tendon; RS, random scaffold; ARS, aligned-random scaffold; H&E, hematoxylin and eosin.
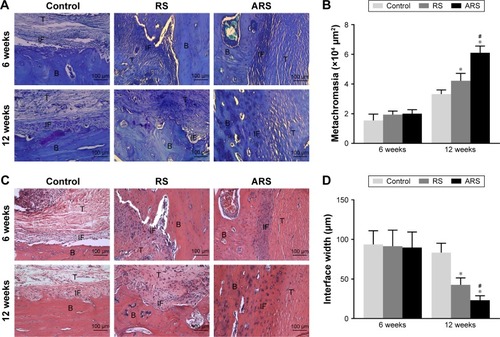
Table 1 Yamakado interface morphological grade
Figure 4 Results of Picrosirius red staining evaluation of the control group, the RS group, and the ARS group at 12 weeks after surgery.
Notes: (A) Images observed under normal condition are shown on the first row. Corresponding sections observed under polarizing condition are shown on the second row. Partial magnifications of the red rectangle area are displayed on the third row. Collagen density analysis includes the reddish-yellow fiber area/total tendon area ratio (B) and the green fiber area/total tendon area ratio (C). The collagen fibers are most mature in the ARS group at 12 weeks after surgery. *P<0.05 vs control, #P<0.05 vs RS group.
Abbreviations: T, tendon; B, bone; IF, interface; RS, random scaffold; ARS, aligned-random scaffold.
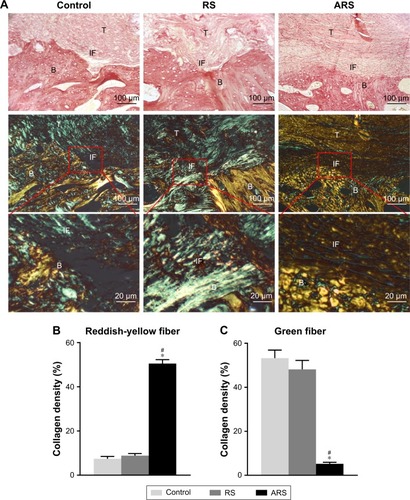
Figure 5 Micro-CT analysis of the control group, the RS group, and the ARS group at 12 weeks after surgery.
Notes: (A) Micro-CT scans of the specimens of three groups at 12 weeks after surgery. (B) Quantification of the average bone tunnel area. (C) The BV/TV value. Smaller bone tunnel area and higher BV/TV value indicate higher new bone formation. *P<0.05 vs control.
Abbreviations: micro-CT, microcomputed tomography; BV/TV, trabecular bone volume fraction of the total tissue volume; RS, random scaffold; ARS, aligned-random scaffold.
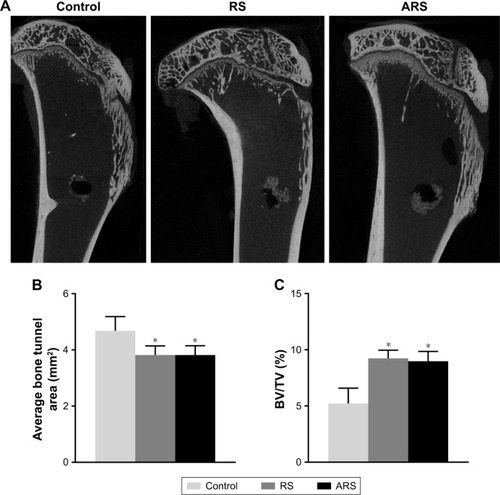
Figure 6 Biomechanical testing for tendon-to-bone healing of the control group, the RS group, and the ARS group at 6 and 12 weeks after surgery.
Notes: (A, B) Digital camera image of biomechanical test experiment of implanted graft. Red arrow points to the graft. (C) Comparison of the maximal failure load among the three groups. (D) Comparison of the stiffness among the three groups. The ARS group showed best biomechanical property at 6 and 12 weeks after surgery. *P<0.05 vs control, #P<0.05 vs RS group.
Abbreviations: RS, random scaffold; ARS, aligned-random scaffold.
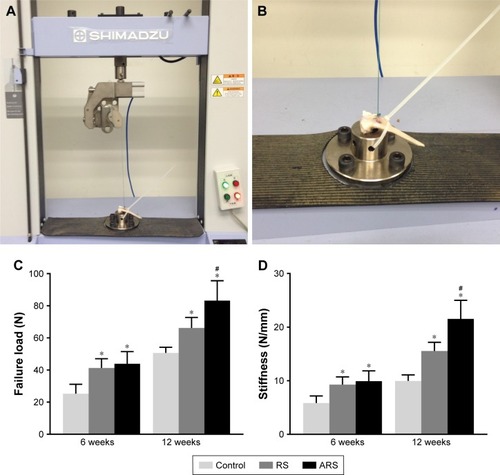
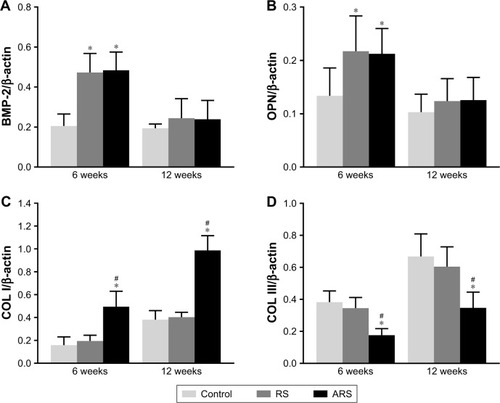
Figure 7 Comparison of the relative mRNA expression of individual genes at the interfacial tissue between graft and host bone of the control group, the RS group, and the ARS group at 6 and 12 weeks after surgery.
Notes: Comparison of the relative mRNA expression of BMP-2 (A), OPN (B), COL I (C), and COL III (D) at 6 and 12 weeks among the three groups. BMP-2 and OPN indicate the osteogenic level, and COL I and COL III indicate the mature level of collagen fibers. *P<0.05 vs control, #P<0.05 vs RS group.
Abbreviations: BMP-2, bone morphogenetic protein 2; OPN, osteopontin; COL I, collagen I; COL III, collagen III; RS, random scaffold; ARS, aligned-random scaffold.