Figures & data
Table 1 Dispersion of zinc oxide nanoparticles
Figure 1 (A) Scanning electron microscope image of monodispersed zinc oxide nanoparticles. (B) Size distribution of zinc oxide nanoparticles.
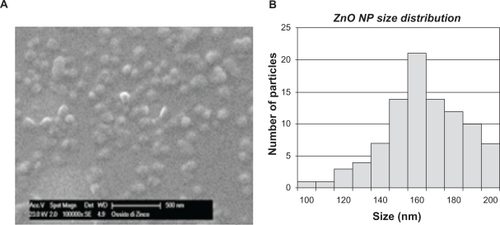
Figure 2 Energy dispersive spectroscopy analysis of zinc oxide nanoparticles.
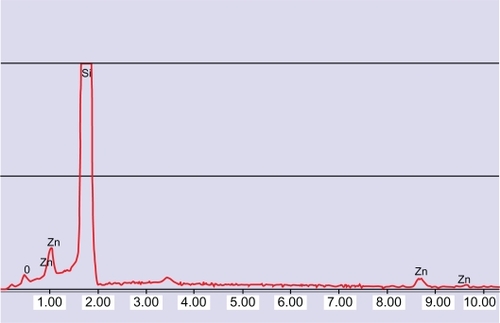
Figure 3 MTT cell proliferation assays of SH -SY5Y cells incubated for 24 hours with different concentrations of zinc oxide nanoparticles (mean ± standard error, n = 6).
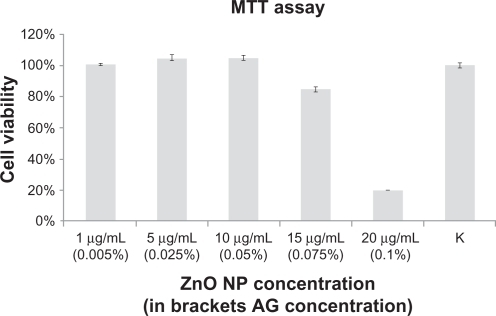
Figure 4 MTT cell proliferation assays of SH-SY5Y cells at different incubation times with a concentration of 15 μg/mL (mean ± standard error, n = 6).
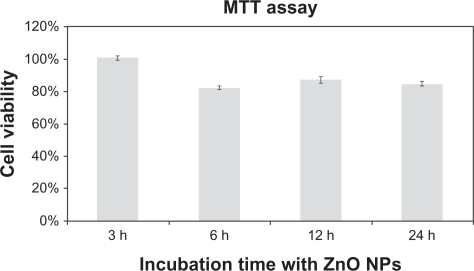
Figure 5 Detection of intracellular reactive oxygen species in (A) SH-SY5Y treated with tert-butyl hydroperoxide, a common inducer of reactive oxygen species (positive control), (B) SH-SY5Y treated with zinc oxide nanoparticle-modified culture medium (15 μg/mL), (C) SH-SY5Y treated with culture medium added with Arabic gum 0.075%. Top images: oxidative stress is represented by green fluorescent cells. Bottom images: bright field. (n = 3). Scale bar: 10 μm.
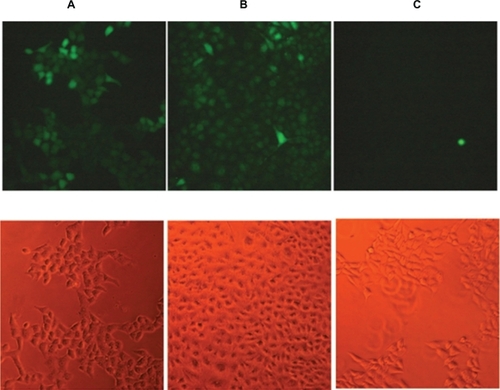
Figure 6 Prediction of the intracellular concentration, Ci (M), versus time for the different ZnO NP concentrations by mathematical modeling.
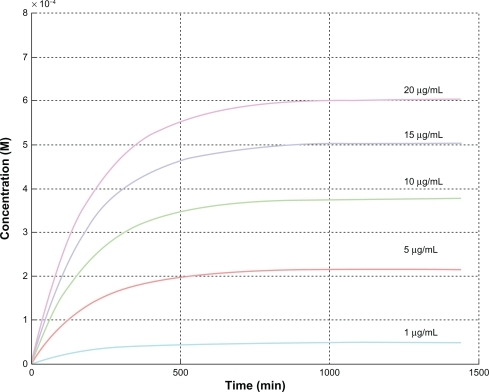
Figure 7 Flow cytometry. (A) Mesenchymal stem cells cultured in cell culture medium modified with zinc oxide nanoparticles. (B) Mesenchymal stem cells cultured in cell culture medium. (C) Osteocytes cultured in cell culture medium modified with zinc oxide nanoparticles. (D) Osteocytes cultured in cell culture medium. (E) Mesenchymal stem cells and osteocytes cocultured in cell culture medium modified with zinc oxide nanoparticles. (F) Mesenchymal stem cells and osteocytes cocultured in cell culture medium. (Zinc oxide nanoparticle concentration 20 μg/mL; incubation time six hours).
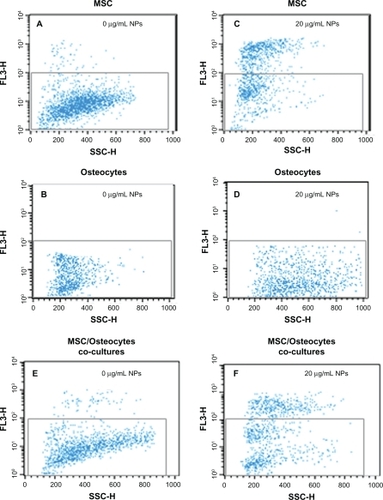
Figure 8 Zinc oxide nanoparticle toxicity in mesenchymal stem cells versus osteocytes. Cultures were treated with zinc oxide nanoparticles for 6 hours and cell viability was determined using flow cytometry and propidium iodide uptake (mean ± standard error, n = 4).
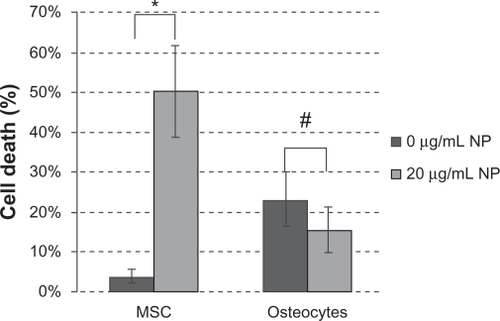
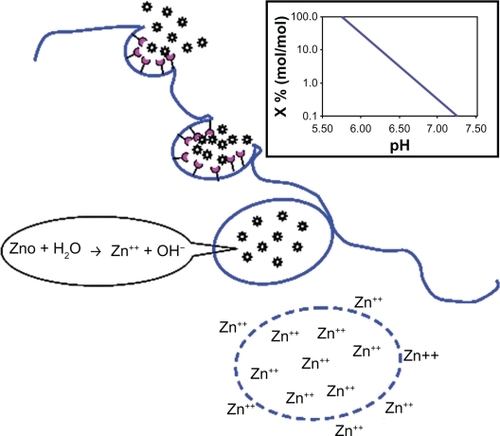
Figure 9 Schematic model of zinc oxide nanoparticle cytotoxicity. Inset: pH-dependent hydrolysis of zinc oxide.