Figures & data
Table 1 Physicochemical characteristics of SN-38-loaded liposomes and SN-38 entrapment inside vesicles
Figure 1 Physical stability of SN-38 liposome preparations.
Notes: (A) Optical density measurements of SN-38 liposome suspensions. The measurements were conducted for each formulation indicated in the x-axis. The grup of bars for each formulation corresponds to samples immediately after preparation, and also 24, 72, and 168 h after preparation, from dark blue to light blue. Samples were stored at 4°C in the dark. (B) Size and (C) SN-38 retention rate during storage of lyophilized SN-38 loaded liposomes. The measurements were undertaken for each formulation indicated in the x-axis. The grup of bars for each formulation corresponds to samples after rehydration of freshly lyophilized samples and at 24 and 168 h after storage, from dark pink to light pink. The measurements were performed, from left to right, after rehydration of freshly lyophilized samples and 24, and 168 h after storage. Data correspond to mean values ± SD of, at least, three different experiments.
Abbreviations: SLE, soy bean lipid extract; SN-38, irinotecan metabolite; DOC, DSPC/DOPS/CHOL; DSPC, L-α-distearoyl-phospathidylcholine; DOPS, L-α-dioleoyl-phospathidylserine; CHOL, cholesterol; EPC, egg yolk phosphatidylcholine; Zave, Z-average mean.
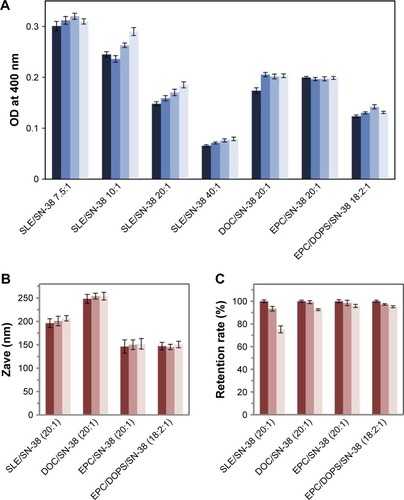
Figure 2 SEM and TEM images.
Notes: SEM (A) and TEM (B) images of a lyophilized preparation of SN-38-loaded EPC/DOPS liposomes. The bar is equivalent to 100 nm.
Abbreviations: TEM, transmission electron microscopy; SEM, scanning electron microscopy; SN-38, irinotecan metabolite; EPC, egg yolk phosphatidylcholine; DOPS, L-α-dioleoyl-phosphatidylserine.
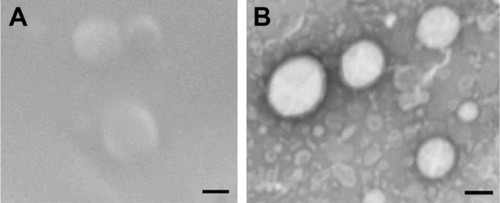
Figure 3 Cytotoxic effect of SN-38 solubilized in dimethyl sulfoxide (DMSO) and encapsulated in liposomes.
Notes: (A) Survival (%) of HeLa cells after treatment with SN-38 encapsulated in SLE liposomes at different molar ratios. (B) Survival (%) of HeLa cells after treatment with SN-38 encapsulated in liposomes with the compositions indicated, at the same lipid/drug molar ratio (20:1) and in DMSO solution. For (A) and (B), cells were incubated for 24 h with the drug and survival was evaluated 3, 24, and 48 h after drug removal by the MTT assay. Cell survival in the presence of the amount of blank liposomes or DMSO in the incubation medium, which would contain the amount of drug to provide all tested SN-38 concentrations, was always between 96% and 98%. Data correspond to mean values ± SD of at least three different experiments.
Abbreviations: SLE, soy bean lipid extract; SN-38, irinotecan metabolite; DOC, DSPC/DOPS/CHOL; DSPC, L-α-distearoyl-phospathidylcholine; DOPS, L-α-dioleoyl-phosphatidylserine; CHOL, cholesterol; EPC, egg yolk phosphatidylcholine.
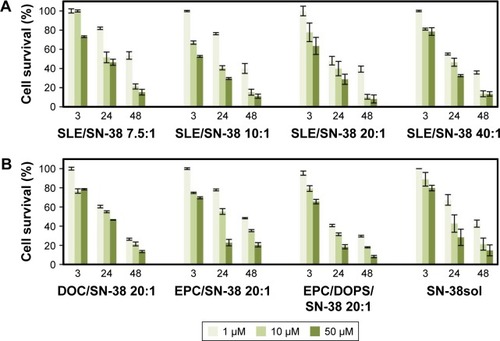
Figure 4 Assessment of survival of HeLa and Caco-2 cells.
Notes: Cells were incubated with 10 µM SN-38, both in liposomal form and in dimethyl sulfoxide (DMSO) solution, for 24 (left panels) and 48 h (right panels). The surviving fraction was evaluated 0, 24, and 48 h after drug removal by the MTT assay. Cell survival in the presence of the amount of blank liposomes and DMSO, which would contain the amount of drug to provide 10 µM SN-38 in the incubation medium, was always between 96% and 98%. Data correspond to mean values ± SD of at least six different experiments. P-values <0.03 (*), 0.008 (**), and 0.0001 (***) were statistically significant.
Abbreviations: SN-38sol, irinotecan metabolite solution in DMSO; SN-38lip, irinotecan metabolite in liposomal form.
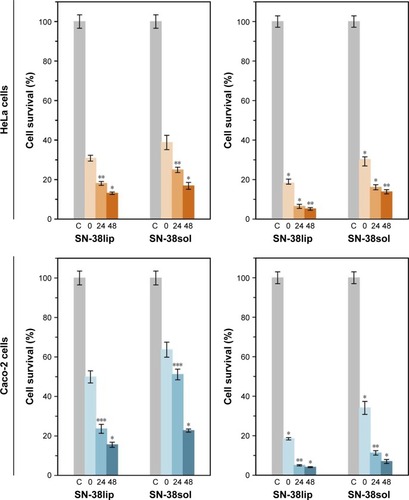
Figure 5 Uptake of SN-38 by HeLa and Caco-2 cells.
Notes: The internalization of the drug was quantified by flow cytometry. Emission fluorescence at 450 nm was determined after excitation at 405 nm. Data are the mean ± SD from three independent experiments. Significance was assessed using a Student’s paired t-test; P-values <0.02 (*), <0.06 (**), and <0.003 (***). Fluorescence profiles are representative of the three experiments analyzed. The color of the curves indicate the different incubation times: 0 h (black); 3 h (turquoise blue); 6 h (blue); 24 h (red) and 48 h (lilac).
Abbreviations: SN-38sol, irinotecan metabolite solution in DMSO; SN-38lip, irinotecan metabolite in liposomal form.
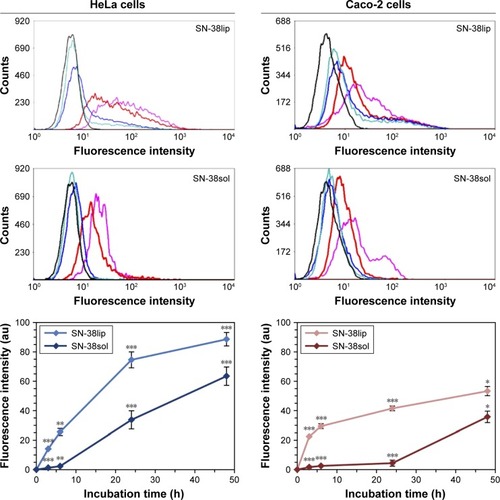
Figure 6 Flow cytometry analysis of cell-cycle phase distribution.
Notes: Cell-cycle phase distribution was analyzed after incubation with SN-38lip (10 µM) for 24 and 48 h. (A) HeLa (upper panels) and Caco-2 (lower panels) cells. Cell-cycle profiles were acquired for non-treated cells (control) and immediately (24+0 h, 48+0 h) after treatment and 24 h after drug removal (24+24 h, 48+24 h). For comparative purposes, typical profiles that were acquired while maintaining the same scale for total counts (y-axis, from 0 to 1,100) and DNA content (x-axis, from 0 to 256), are shown. (B) Percentage of cells in each cell-cycle phase calculated from the histograms. (C) Percentages of detached cells in each phase. For each experiment, a minimum of 20,000 events were analyzed.
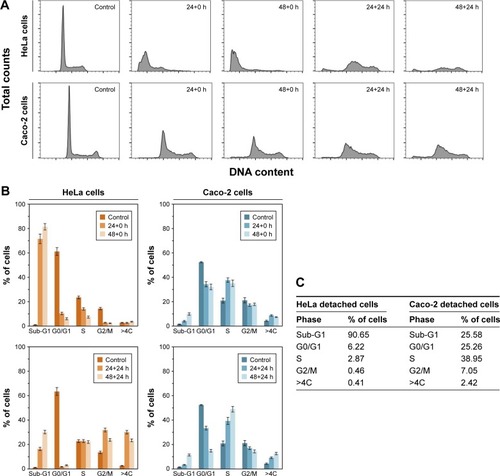
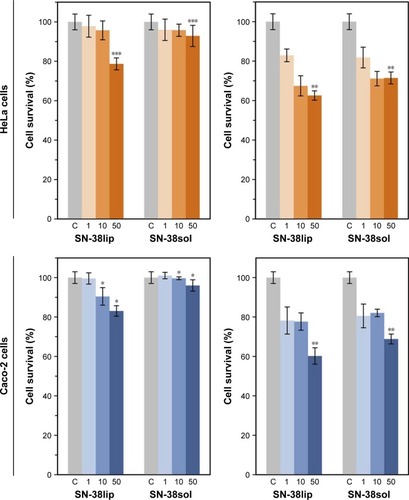
Figure 7 LDH assay after treatment of HeLa and Caco-2 cells with SN-38.
Notes: HeLa and Caco-2 cells were treated with SN-38lip and SN-38sol formulations. The numbers along the x-axis indicate the SN-38 concentration; 1, 10, and 50 µM. LDH release was measured at 24 (left panels) and 48 h (right panels). The columns represent the mean percentage of cell survival calculated from LDH release and the error bars (±SD) from three independent experiments. Significance was assessed using a Student’s paired t-test; P-values <0.05 (*), <0.03 (**) and <0.02 (***). The data of LDH activity in the culture medium was normalized with the total protein content.
Abbreviations: SN-38sol, irinotecan metabolite solution in DMSO; SN-38lip, irinotecan metabolite in liposomal form.