Figures & data
Figure 1 (A) UV-vis and (B) FTIR spectra for NIPAM-hemin (red), hemin (blue), NIPAM (green), and poly-NIPAM (MW=66,400 Da) (purple).
Abbreviations: FTIR, Fourier-transform infrared; NIPAM, N-isopropylacrylamide; hemin, ferriprotoporphyrin IX chloride; MW, molecular weight.
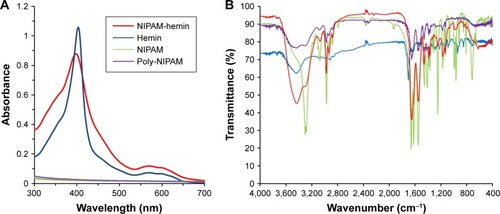
Figure 2 Cytotoxicity assay for NIPAM-hemin in (A) 293XL/null and (B) RAW 264 cells. Cells were incubated with NIPAM-hemin for 24 h in 96-well plates; cell viability was estimated by measuring the absorbance at 450 nm.
Notes: Data are expressed as the mean±SD (n=5). *P<0.05 vs no treatment group.
Abbreviations: NIPAM, N-isopropylacrylamide; hemin, ferriprotoporphyrin IX chloride.
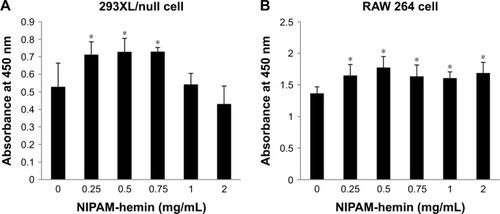
Figure 3 NIPAM-hemin induced the production of IFN-γ and IL-6, and had a lesser effect on the induction of IL-1β, in PBMCs. PBMCs were stimulated with NIPAM-hemin, hemin, NIPAM, or poly-NIPAM (MW=66,400). The levels of (A) IFN-γ, (B) IL-6, and (C) IL-1β were determined after 48 h. The concentration of each stimulant was 500 μg/mL. Hemin was dissolved in DMSO, while the other compounds were dissolved in sterilized deionized water.
Notes: Data are expressed as the mean±SD (n=3). *P<0.05; #IFN-γ, IL-6, and IL-1β were produced at levels lower than the detectable minima of 3.91 pg/mL, 1.95 pg/mL, and 2.34 pg/mL, respectively.
Abbreviations: NIPAM, N-isopropylacrylamide; hemin, ferriprotoporphyrin IX chloride; IFN-γ, interferon-γ; IL, interleukin; PBMCs, peripheral blood mononuclear cells; MW, molecular weight; DMSO, dimethyl sulfoxide.
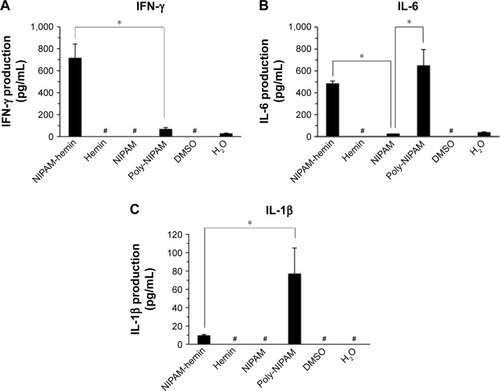
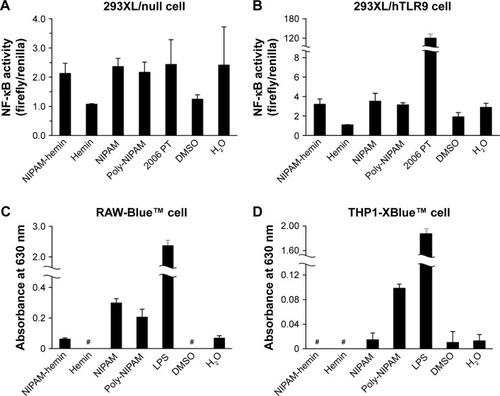
Figure 4 NIPAM-hemin did not induce NF-κB signaling via most TLRs in reporter cells. (A) 293XL/null cells, (B) 293XL/hTLR9 cells, (C) RAW-Blue cells, and (D) THP1-XBlue cells were incubated with 500 μg/mL NIPAM-hemin, hemin, NIPAM, or poly-NIPAM (MW=66,400 Da). LPS (500 μg/mL) or 2006 PT (0.5 μM), agonists for TLR4 and TLR9, respectively, were added to the cells as positive controls. Hemin was dissolved in DMSO, while the other compounds were dissolved in sterilized deionized water.
Notes: Data are expressed as the mean±SD (n=5). #Absorbance not detected.
Abbreviations: NIPAM, N-isopropylacrylamide; hemin, ferriprotoporphyrin IX chloride; NF-κB, nuclear factor-κB; LPS, lipopolysaccharide; MW, molecular weight; DMSO, dimethyl sulfoxide.
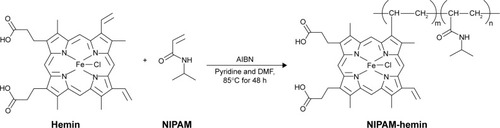
Scheme 1 The process of NIPAM-hemin synthesis.
Abbreviations: AIBN, 2,2′-azodiisobutyronitrile; DMF, N,N-dimethylformamide; Hemin, ferriprotoporphyrin IX chloride; NIPAM, N-isopropylacrylamide.
Scheme 2 The evaluation of the immunostimulatory effects of NIPAM-hemin.
Abbreviations: NIPAM, N-isopropylacrylamide; hemin, ferriprotoporphyrin IX chloride; IFN-γ, interferon-γ; IL, interleukin; NK, natural killer; PBMCs, peripheral blood mononuclear cells; ELISA, enzyme-linked immunosorbent assay; TLRs, toll-like receptors; SEAP, secreted embryonic alkaline phosphatase.
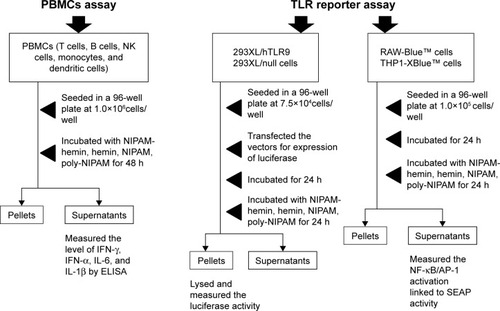
Table 1 The type of major adjuvants used for the development of vaccines
Figure S1 FTIR spectra of a mixture of hemin monomer and poly-NIPAM (MW=66,400 Da).
Notes: The molar ratio of hemin and NIPAM in poly-NIPAM was adjusted to 1:37. The broken line shows the peaks attributed to the hemin monomer.
Abbreviations: FTIR, Fourier-transform infrared; hemin, ferriprotoporphyrin IX chloride; MW, molecular weight; NIPAM, N-isopropylacrylamide.
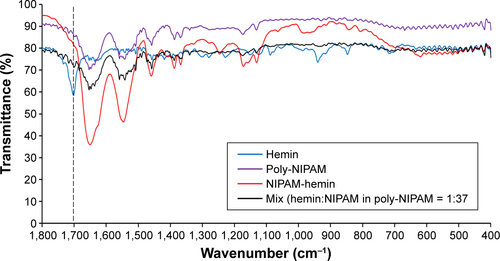
Figure S2 Poly-NIPAM (MW=66,400 Da) formed particles at 37°C in water.
Note: Particle size was determined by DLS measurement.
Abbreviations: NIPAM, N-isopropylacrylamide; MW, molecular weight; DLS, dynamic light scattering.
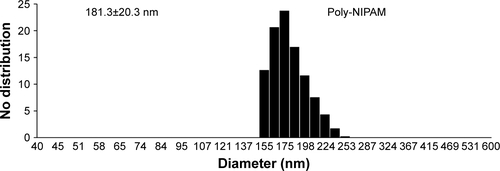
Figure S3 NIPAM-hemin was not cytotoxic to RAW 264 cells after incubation for 48 h. Cells were incubated with NIPAM-hemin for 48 h in 96-well plates; cell viability was estimated by measuring the absorbance at 450 nm.
Notes: Data are expressed as the mean±SD (n=5). *P<0.05 vs no treatment group.
Abbreviations: NIPAM, N-isopropylacrylamide; hemin, ferriprotoporphyrin IX chloride.
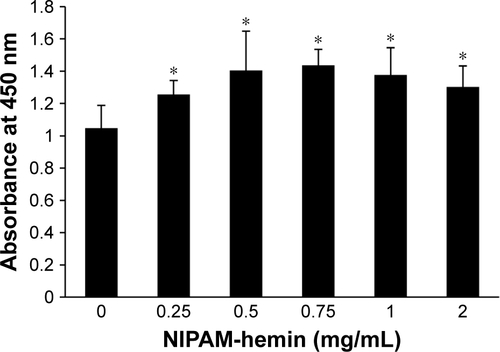
Figure S4 Poly-NIPAM was not cytotoxic to (A) 293XL/null and (B) RAW 264 cells. Cells were incubated with poly-NIPAM for 24 h in a 96-well plate and cell viability was estimated by measuring the absorbance at 450 nm.
Notes: Data are expressed as the mean±SD (n=5). *P<0.05 vs no treatment group.
Abbreviation: NIPAM, N-isopropylacrylamide.
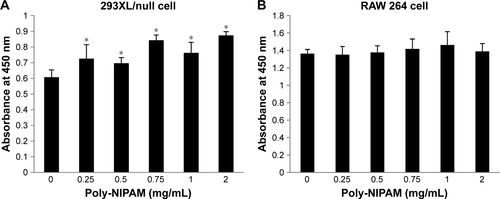
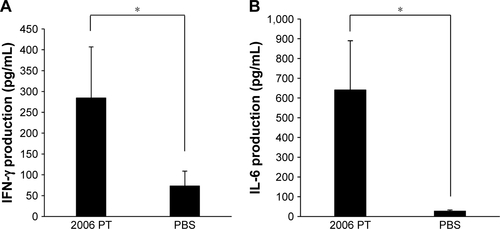
Figure S5 The levels of IFN-γ and IL-6 production in PBMCs after incubation with 2006 PT. PBMCs were stimulated with 2006 PT (0.5 μM); the amounts of (A) IFN-γ and (B) IL-6 were determined after incubation for 48 h.
Notes: Data are expressed as the mean±SD (n=6–9). *P<0.05.
Abbreviations: IFN-γ, interferon-γ; IL, interleukin; PBMCs, peripheral blood mononuclear cells.