Figures & data
Table 1 The stirring and dialyzing time and MWCO of the copolymers synthesis
Table 2 MW, TEM, LK-, and PTX-loading capacity of the nanocarrier
Figure 1 Synthesis of PEG-b-(PELG-g-(PZLL-r-PLL)).
Note: x, y, m, and n represent the degree of polymerization.
Abbreviations: 2-HP, 2-hydroxypyridine; DMF, N,N-dimethylformamide; PEG-NH2, poly(ethylene glycol) amine; PEG-b-PBLG, poly(ethylene glycol)-b-poly(γ-benzyl l-glutamate); PEG-b-PELG, poly(ethylene glycol)-b-poly(ethylenediamine l-glutamate); PEG-b-(PELG-g-PZLL), poly(ethylene glycol)-b-(poly(ethylenediamine l-glutamate)-g-poly (ε-benzyoxycarbonyl-l-lysine)); PEG-b-(PELG-g-(PZLL-r-PLL)), poly(ethylene glycol)-b-(poly(ethylenediamine l-glutamate)-g-poly(ε-benzyoxycarbonyl-l-lysine)-r-poly(l-lysine)).
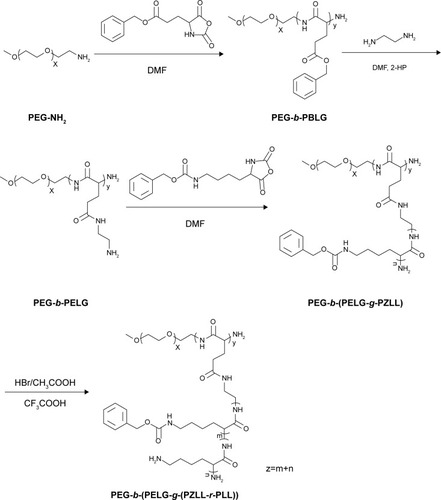
Figure 2 Characterization of nanocomplexes.
Notes: (A) 1H NMR spectra of PEG-b-(PELG-g-(PZLL-r-PLL)); (B) TEM image of copolymers, (a) PEG-b-(PELG-g-(PZLL-r-PLL)), (b) LK/PEG-b-(PELG-g-(PZLL-r-PLL)), (c) PTX/PEG-b-(PELG-g-(PZLL-r-PLL)), and (d) LK/PTX/PEG-b-(PELG-g-(PZLL-r-PLL)); (C) Loading pattern diagram of PEG-b-(PELG-g-(PZLL-r-PLL)); (D) Cumulative releasing profile of LK and PTX from PEG-b-(PELG-g-(PZLL-r-PLL)) complexes (n=5); (E) Relative cell viability (n=5); (F) Absorbance value of cell proliferation (n=5); (G) Inhibition ratio of cell proliferation (n=5). Data are expressed as the mean ± SD. *p<0.01 vs control, **p<0.05 vs LK or PTX, ***p<0.01 vs LK/P or PTX/P.
Abbreviations: 1H NMR, 1H nuclear magnetic resonance; LK, lumbrokinase; P, PEG-b-(PELG-g-(PZLL-r-PLL)); PEG-b-(PELG-g-(PZLL-r-PLL)), poly(ethylene glycol)-b-(poly(ethylenediamine l-glutamate)-g-poly(ε-benzyoxycarbonyl-l-lysine)-r-poly(l-lysine)); PTX, paclitaxel.
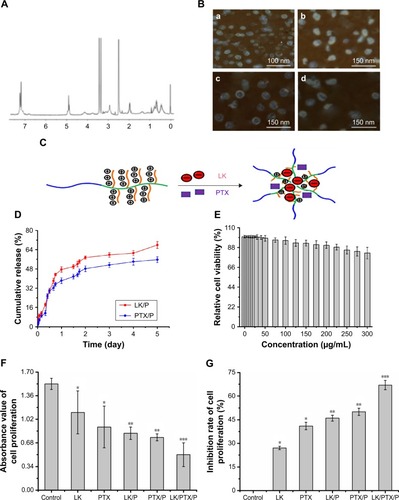
Figure 3 Cell apoptosis.
Notes: (A) Control; (B) LK; (C) PTX; (D) LK/P; (E) PTX/P; (F) LK/PTX/P; (G) Cell apoptosis rate. Scale bar 40 µm. Data are expressed as the mean ± SD, n=5. *p<0.01 vs Control, **p<0.05 vs LK or PTX, ***p<0.01 vs LK/P or PTX/P.
Abbreviations: LK, lumbrokinase; P, PEG-b-(PELG-g-(PZLL-r-PLL)); PEG-b-(PELG-g-(PZLL-r-PLL)), poly(ethylene glycol)-b-(poly(ethylenediamine l-glutamate)-g-poly(ε-benzyoxycarbonyl-l-lysine)-r-poly(l-lysine)); PTX, paclitaxel.
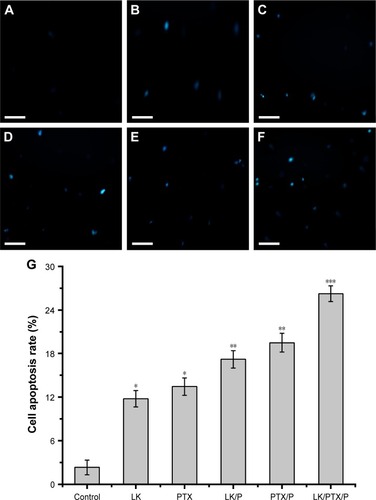
Figure 4 Blood concentration of LK and PTX.
Notes: (A) Blood LK concentration; (B) Blood PTX concentration. Data are expressed as the mean ± SD, n=7.
Abbreviations: LK, lumbrokinase; P, PEG-b-(PELG-g-(PZLL-r-PLL)); PEG-b-(PELG-g-(PZLL-r-PLL)), poly(ethylene glycol)-b-(poly(ethylenediamine l-glutamate)-g-poly(ε-benzyoxycarbonyl-l-lysine)-r-poly(l-lysine)); PTX, paclitaxel.
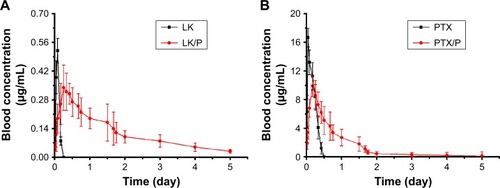
Figure 5 Lifespan and life prolongation rate.
Notes: (A) Lifespan; (B) Life prolongation rate. Data are expressed as the mean ± SD, n=10. *p<0.01 vs Control, **p<0.05 vs LK or PTX, ***p<0.01 vs LK/P or PTX/P.
Abbreviations: LK, lumbrokinase; P, PEG-b-(PELG-g-(PZLL-r-PLL)); PEG-b-(PELG-g-(PZLL-r-PLL)), poly(ethylene glycol)-b-(poly(ethylenediamine l-glutamate)-g-poly(ε-benzyoxycarbonyl-l-lysine)-r-poly(l-lysine)); PTX, paclitaxel.
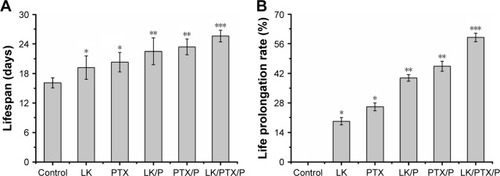
Figure 6 Average tumor weight and tumor inhibition rate.
Notes: (A) Average tumor weight; (B) Tumor inhibition rate. Data are expressed as the mean ± SD, n=10. *p<0.01 vs Control, **p<0.05 vs LK or PTX, ***p<0.01 vs LK/P or PTX/P.
Abbreviations: LK, lumbrokinase; P, PEG-b-(PELG-g-(PZLL-r-PLL)); PEG-b-(PELG-g-(PZLL-r-PLL)), poly(ethylene glycol)-b-(poly(ethylenediamine l-glutamate)-g-poly(ε-benzyoxycarbonyl-l-lysine)-r-poly(l-lysine)); PTX, paclitaxel.
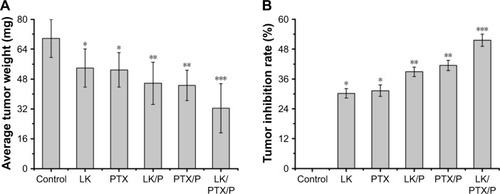
Table 3 The bladder cancer incidence in rats
Figure 7 Histopathology.
Notes: (A) Control; (B) LK; (C) PTX; (D) LK/P; (E) PTX/P; (F) LK/PTX/P. Disorganized cells, pathological mitotic figure, and papillary hyperplasia are observed in local or multiple regions in the Control group; the cell abnormality in LK and PTX groups is lower than that of the Control group; the cell abnormality in the LK/P and PTX/P groups is lower than that of the LK and PTX groups; and the cell abnormality in the LK/PTX/P group is significantly lower than that of the LK/P and PTX/P groups. Hematoxylin-Eosin staining, magnification ×100.
Abbreviations: LK, lumbrokinase; P, PEG-b-(PELG-g-(PZLL-r-PLL)); PEG-b-(PELG-g-(PZLL-r-PLL)), poly(ethylene glycol)-b-(poly(ethylenediamine l-glutamate)-g-poly(ε-benzyoxycarbonyl-l-lysine)-r-poly(l-lysine)); PTX, paclitaxel.
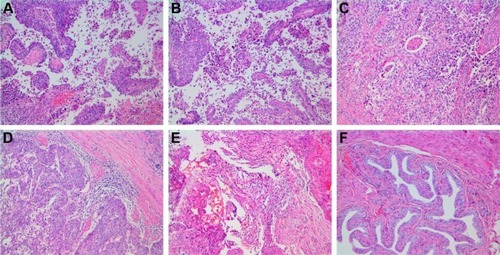
Figure 8 CD34 expression and MVD in the rat bladder cancer tissue.
Notes: (A) Control; (B) LK; (C) PTX; (D) LK/P; (E) PTX/P; (F) LK/PTX/P; (G) MVD. Immunohistochemical staining, magnification ×200. Data are expressed as the mean ± SD, n=10. *p<0.01 vs Control, **p<0.05 vs LK or PTX, ***p<0.01 vs LK/P or PTX/P.
Abbreviations: HPF, high-power field in an optical microscope; LK, lumbrokinase; MVD, microvessel density; P, PEG-b-(PELG-g-(PZLL-r-PLL)); PEG-b-(PELG-g-(PZLL-r-PLL)), poly(ethylene glycol)-b-(poly(ethylenediamine l-glutamate)-g-poly(ε-benzyoxycarbonyl-l-lysine)-r-poly(l-Lysine)); PTX, paclitaxel.
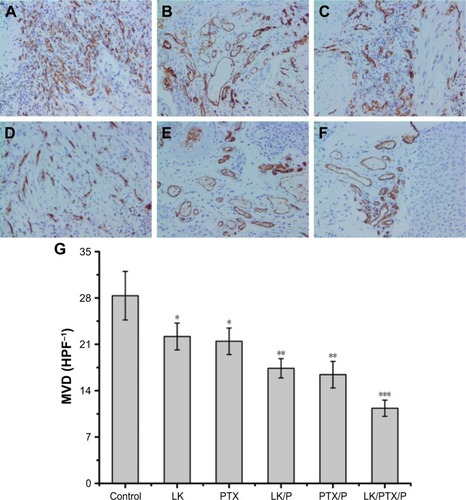
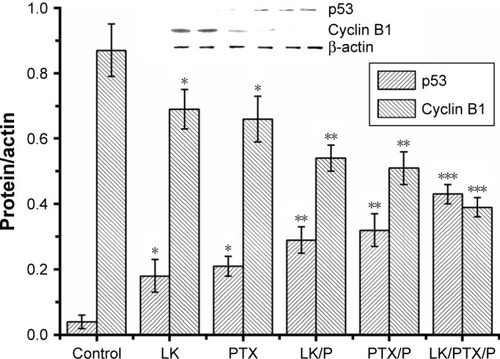
Figure 9 Expression of p53 and cyclin B1 in the rat bladder cancer tissue.
Notes: Data are expressed as the mean ± SD, n=10. *p<0.01 vs Control, **p<0.05 vs LK or PTX, ***p<0.01 vs LK/P or PTX/P.
Abbreviations: LK, lumbrokinase; P, PEG-b-(PELG-g-(PZLL-r-PLL)); PEG-b-(PELG-g-(PZLL-r-PLL)), poly(ethylene glycol)-b-(poly(ethylenediamine l-glutamate)-g-poly (ε-benzyoxycarbonyl-l-lysine)-r-poly(l-lysine)); PTX, paclitaxel.