Figures & data
Table 1 List of primer sequences for gene expression analyses by quantitative real-time polymerase chain reaction
Figure 1 Normalized Raman spectra of raw, purified, and functionalized SWCNT solutions showing the presence of SWCNT characteristic RBM and G-band features.
Abbreviations: R, raw; P, purified; f, functionalized; SWCNT, single-walled carbon nanotubes; RBM, radial breathing mode.
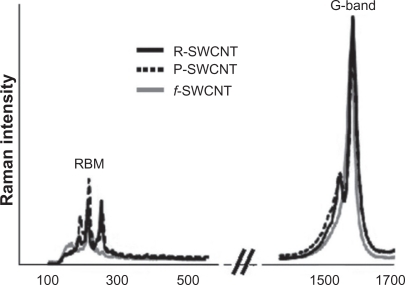
Figure 2 Superconducting quantum interference device magnetization measurements. A) Temperature dependence of zero-field-cooled and field-cooled measurements, recorded at a magnetic field of 50 Oe for raw, purified, and functionalized SWCNT compared with USPIO nanoparticles. B) Normalized field dependence magnetization of raw and purified SWCNT recorded at room temperature (300 K).
Abbreviations: R, raw; P, purified; f, functionalized; SWCNT, single-walled carbon nanotubes; USPIO, ultrasmall supermagnetic iron oxide.
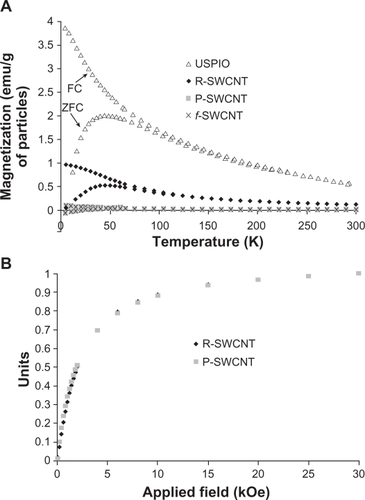
Figure 3 Contrast-to-noise ratio variation of USPIO, raw, purified, and functionalized SWCNT injected groups compared with control values at 5 hours, and days 1, 2, 7, and 14 investigation time points in the A) spleen, B) liver, and C) kidney.
Note: Asterisks indicate statistically different values from the control group (P < 0.05).
Abbreviations: R, raw; P, purified; f, functionalized; SWCNT, single-walled carbon nanotubes; USPIO, ultrasmall supermagnetic iron oxide.
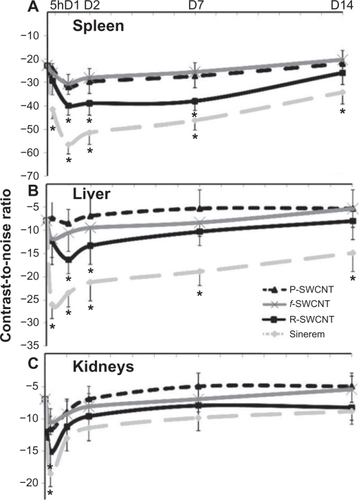
Figure 4 Surface-enhanced Raman spectra of control, raw, purified, and functionalized SWCNT blood samples at 24 hours after injection.
Abbreviations: R, raw; P, purified; f, functionalized; SWCNT, single-walled carbon nanotubes.
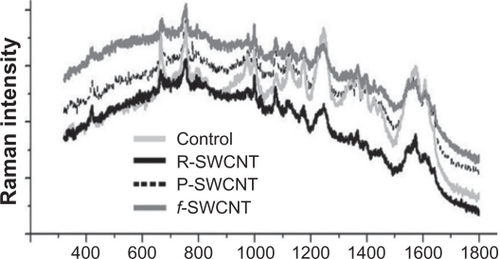
Figure 5 Iron content in μg/g of spleen, liver, kidneys, lungs, and blood for control, USPIO (day 1 and day 14) and raw SWCNT (day 1 and day 14) groups.
Note: Asterisks indicate statistically different values from the control group (P < 0.05).
Abbreviations: R, raw; SWCNT, single-walled carbon nanotubes; D1, day 1; D14, day 14.
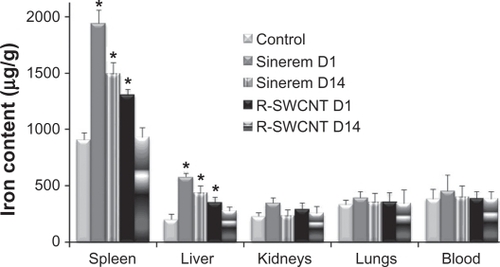
Figure 6 Hematoxylin and eosin-stained histopathological cuts of lung lobe (A control, B injected) and liver (C control, D injected) showing the presence of black SWCNT aggregates after functionalized SWCNT injection at day 1 investigation time point.
Abbreviation: SWCNT, single-walled carbon nanotubes.
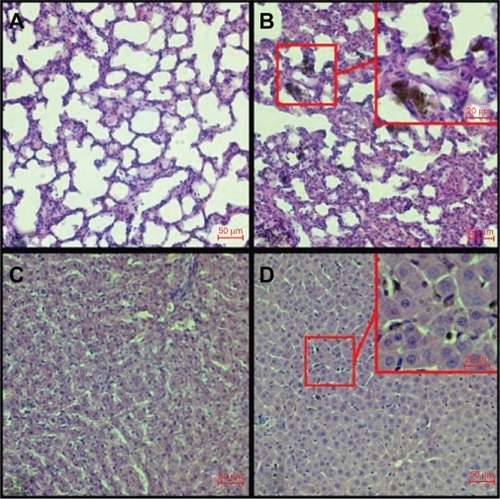
Figure 7 A) One-dimensional 400 mHz high resolution magic angle spinning 1H nuclear magnetic resonance spectra of liver samples acquired using Carr-Purcell-Meiboom-Gill pulse sequence. The numbers refer to the assignments of different peaks arising from the main metabolites (1 lactate, 2 alanine, 3 acetate, 4 glutamate/glutamine, 5 glutathione, 6 phosphocholine/glycerophosphocholine, 7 trimethylamine oxide, 8 glucose/glycogen, 9 β-glucose, 10 α-glucose). B) Principal component analysis score plot showing no clustering of liver samples from the different groups following high resolution magic angle spinning 1H magnetic resonance spectroscopy. C) Partial least squares-discriminant analysis score plot showing clustering between D1 and D14.
Abbreviations: R, raw; P, purified; f, functionalized; SWCNT, single-walled carbon nanotubes; D1, day 1; D14, day 14.
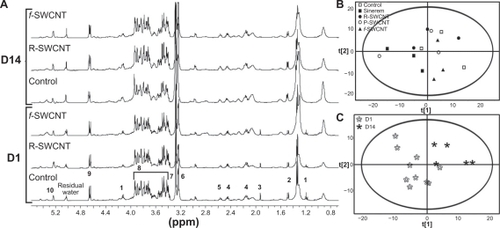
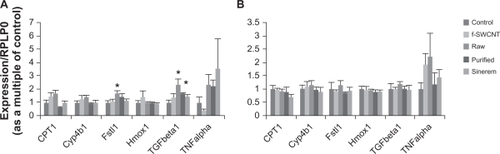
Figure 8 Inflammation and steatosis/fibrosis-specific genes expression in rat liver tissue. Liver tissue from three control rats and three of each of the treated rats with functionalized SWCNT or raw or purified pristine SWCNT or the contrast agent Sinerem®, after 24 hours A) or 14 days after injection B), were used to prepare total RNA according to the experimental procedure. Levels of Cpt1, Cyp4b1, Fstl1, Hmox1, tumor necrosis factor alpha, and transforming growth factor beta, were measured by real-time polymerase chain reaction, normalized to RPLP0 mRNA using the “2−ΔΔCt” formula and expressed in arbitrary units (mean ± standard error of the mean), with control values taken as 1.
Note: *P < 0.05 in treated rats versus control rats using the Student’s t-test.
Abbreviations: f, functionalized; SWCNT, single-walled carbon nanotubes.