Figures & data
Figure 1 FT-IR spectra of chitosan 5k (red) and O-palmitoyl chitosan (black).
Abbreviations: FT-IR, Fourier transform infra-red; T, transmittance.
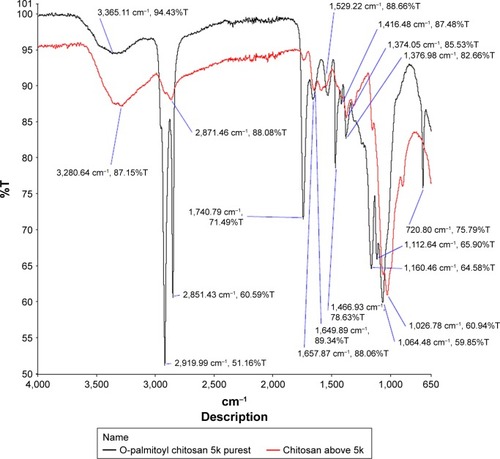
Figure 2 H-NMR spectra of (A) chitosan 5k and (B) O-palmitoyl chitosan.
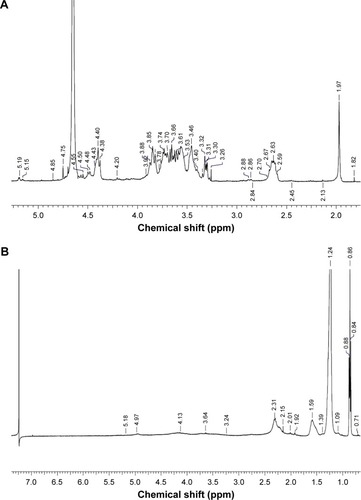
Figure 3 DSC thermogram of (A) chitosan (50°C/min) and (B) O-palmitoyl chitosan (20°C/min).
Abbreviation: DSC, differential scanning calorimetry.
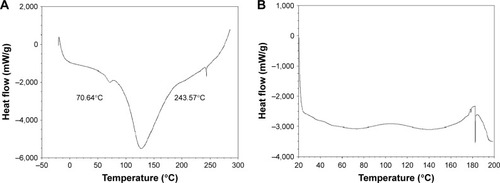
Figure 4 X-ray powder diffractograms of (A) chitosan and (B) O-palmitoyl chitosan.
Abbreviations: ADUs, analog digital units; deg, degrees.
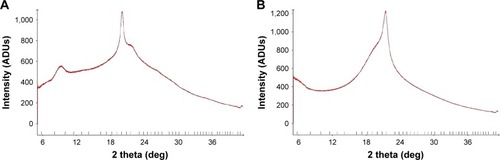
Table 1 Particle size distribution, surface charge, and entrapment efficiencies for liposome preparations
Figure 5 Caco-2 cell viability assessed by MTT assay following (A) 48 hours and (B) 72 hours incubation with liposome formulations containing increasing drug concentrations (mean±SD, n=6).
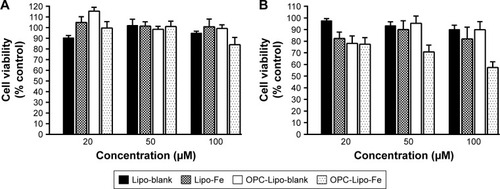
Figure 6 Iron absorption by Caco-2 cells incubated with liposome formulations: intracellular ferritin was measured as a marker of iron absorption by ELISA following 22 hours of incubation after iron uptake experiments.
Note: Results are shown as mean±SD (n=6), *Represents a significant difference (95%) between treatment and FeSO4 alone. ^Represents a significant difference (95%) between OPC liposomes and liposomes alone.
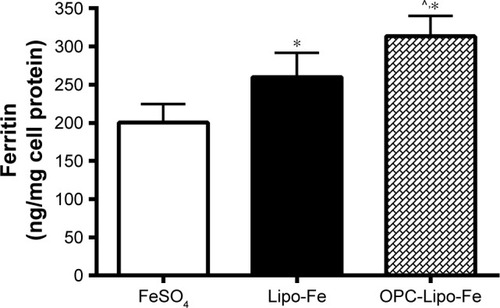
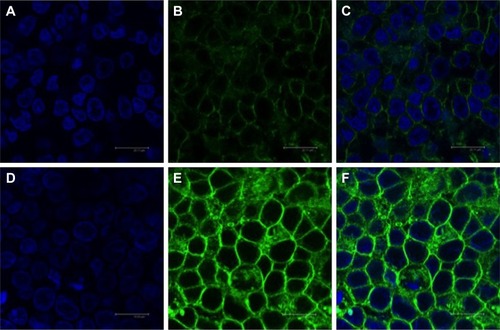
Figure 7 Confocal microscopy images of Caco-2 cells following incubation with coumarin-6 loaded (A–C) conventional (Lipo-Cou) liposomes and (D–F) OPC liposomes (OPC-Lipo-Cou).
Notes: Images (A and D) demonstrate cell nuclei stained with TO-PRO-3 (blue), images (B and E) show cell cytoplasm with accumulated liposomal coumarin-6, and images (C and F) show merged images. Scale shown is 50 µM.