Figures & data
Figure 1 X-ray powder diffraction pattern of lyophilized nanocrystalline cellulose. Intense peaks at 15° and 23° 2θ, due to constructive interference of diffracted x-rays, in addition to the lack of an amorphous halo, indicate the highly crystalline nature of the material.
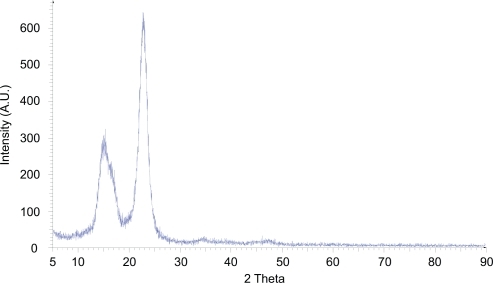
Figure 2 Scanning electron micrograph of a dried film of nanocrystalline cellulose (NCC) (A) and NCC crystallites in deionized distilled water (B).
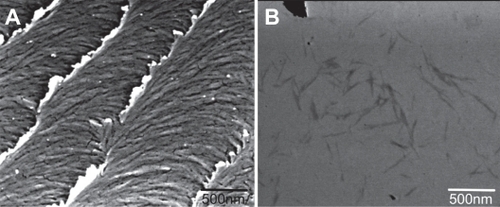
Figure 3 The binding of doxorubicin to 2 mg NCC in 10 mM, pH 7.4 phosphate buffered saline at 25°C (A) and deionized distilled water at 25°C (B).
Abbreviation: NCC, nanocrystalline cellulose.
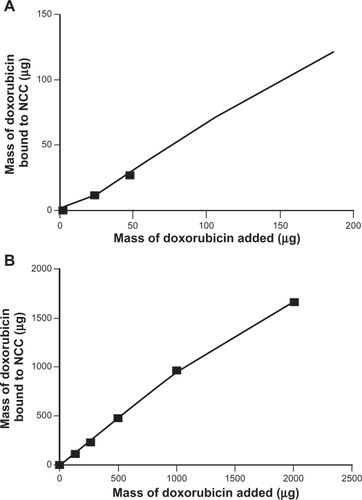
Figure 4 The binding of tetracycline to 2 mg NCC in 10 mM, pH 7.4 phosphate buffered saline at 25°C (A) or deionized distilled water at 25°C (B).
Abbreviation: NCC, nanocrystalline cellulose.
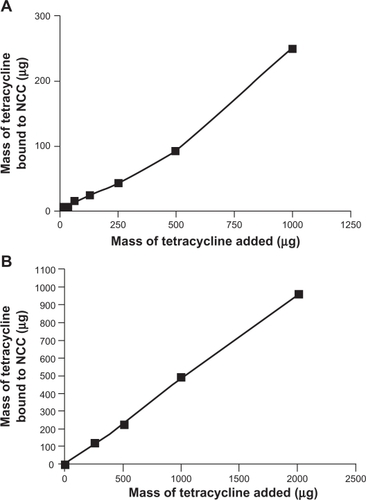
Figure 5 A) The binding of docetaxel to 2.5 mg of NCC/CTAB nanocomplexes in 10 mM NaCl at 25°C with CTAB concentrations of 0 mM (▪), 0.755 mM (▴), 1.51 mM (▾), 2.27 mM (♦), 4.53 mM (•), 6.79 mM (□), and 12.9 mM (Δ). B) Maximal binding of docetaxel at a CTAB concentration of 12.9 mM.
Abbreviations: CTAB, cetyl trimethylammonium bromide; NCC, nanocrystalline cellulose.
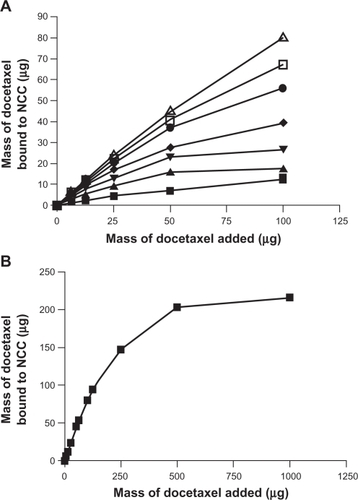
Figure 6 A) The binding of paclitaxel to 2.5 mg of NCC/CTAB nanocomplexes in 10 mM NaCl at 25°C with CTAB concentrations of 0 mM (▪), 0.755 mM (▴), 1.51 mM (▾), 2.27 mM (♦), 4.53 mM (•), 6.79 mM (□), and 12.9 mM (Δ). B) Maximal binding of paclitaxel at a CTAB concentration of 12.9 mM.
Abbreviations: CTAB, cetyl trimethylammonium bromide; NCC, nanocrystalline cellulose.
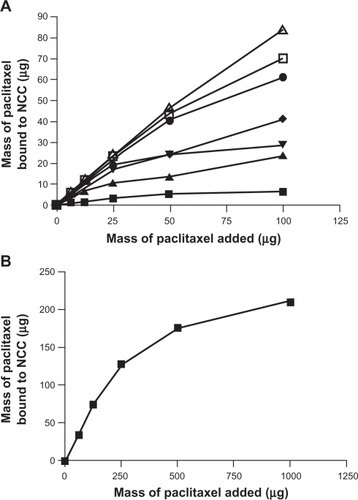
Figure 7 The binding of etoposide to 2.5 mg of NCC/CTAB nanocomplexes in 10 mM NaCl at 25°C with CTAB concentrations of 0 mM (▪), 0.375 mM (▴), 0.755 mM (▾), 1.51 mM (♦), 2.27 mM (•), 4.53 mM (□), and 6.79 mM (Δ), and 12.9 (∇).
Abbreviations: CTAB, cetyl trimethylammonium bromide; NCC, nanocrystalline cellulose.
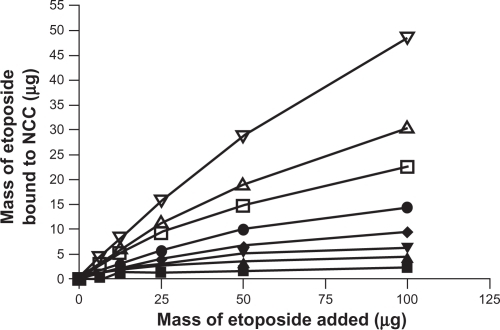
Figure 8 The in vitro release of doxorubicin (Δ) and tetracycline (□) from nanocrystalline cellulose in 10 mM phosphate buffered saline at 37°C.
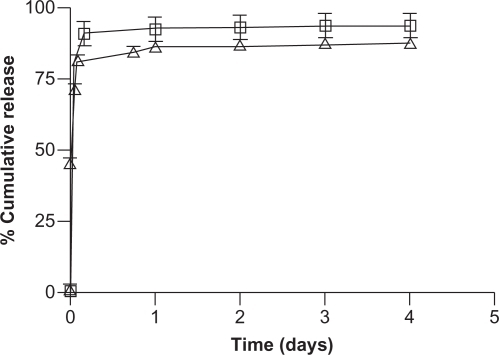
Figure 9 The in vitro release of etoposide (∇), docetaxel (□), and paclitaxel (Δ) from NCC/CTAB nanocomplexes with 12.9 mM CTAB in 10 mM phosphate buffered saline at 37°C.
Abbreviations: CTAB, cetyl trimethylammonium bromide; NCC, nanocrystalline cellulose.
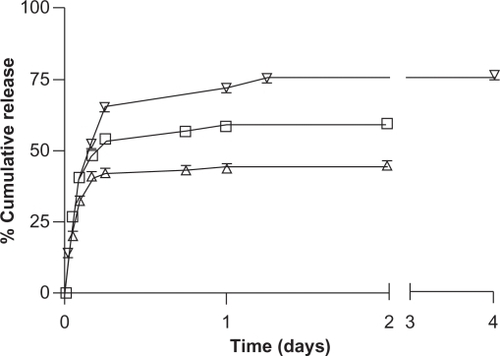
Figure 10 Zeta potential of NCC/CTAB nanocomplexes as a function of CTAB concentration.
Abbreviations: CTAB, cetyl trimethylammonium bromide; NCC, nanocrystalline cellulose.
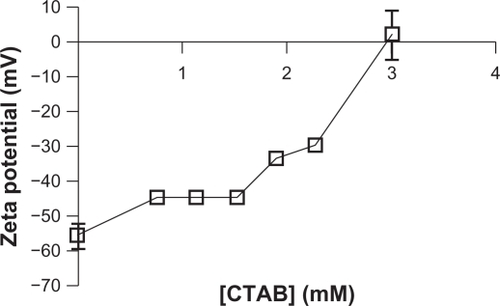
Figure 11 Mass of NCC/CTAB/fluorescein bound to KU-7 cells as a function of concentration of NCC/CTAB/fluorescein added to cells.
Abbreviations: CTAB, cetyl trimethylammonium bromide; NCC, nanocrystalline cellulose.
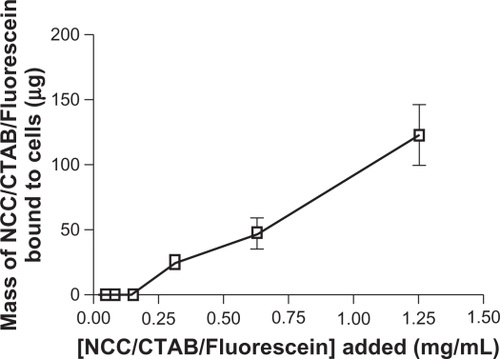
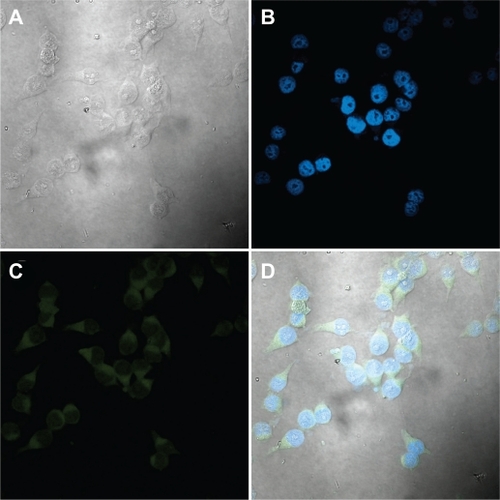
Figure 12 Confocal micrographs of KU-7 cells incubated for 2 hours with NCC/CTAB/fluorescein nanocomplexes with a NCC/CTAB/fluorescein concentration of 0.25 mg/mL. A) White light image of KU-7 cells. B) Staining of the nuclei with DAPI. C) Fluorescein in the cytoplasm. D) An overlay of images B and C.
Abbreviations: CTAB, cetyl trimethylammonium bromide; DAPI, 4′,6-diamidino-2-phenylindole; NCC, nanocrystalline cellulose.