Figures & data
Figure 1 Illustrations of ginsenoside compound-K-based mixed micelles and their mode of action for enhanced antitumor efficacy.
Abbreviaiton: Casp, caspase.
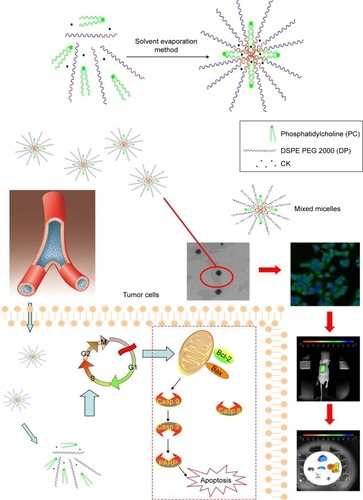
Figure 2 Particle size (A), transmission electron microscope image (B), zeta-potential (C) of CK mixed micelles and their release in vitro (D).
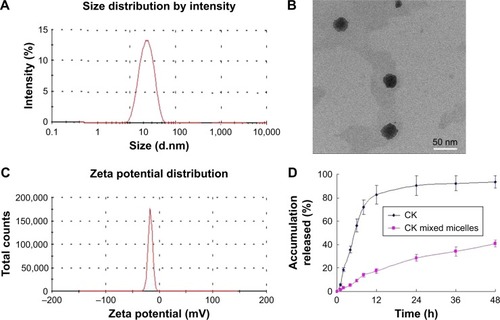
Figure 3 Anticancer effect of CK and CK mixed micelles to A549 cells. Cell proliferation assay (A), cell-cycle analysis assay (B), and wound-healing assay (C) of A549 cells.
Note: Green= G1, brown= S, and blue= G2 phase in B.
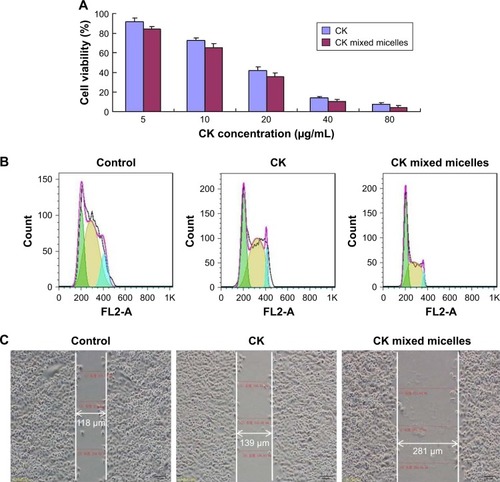
Figure 4 Apoptotic bodies (A) and apoptosis ratio (B) were determined for qualitative and quantitative analysis.
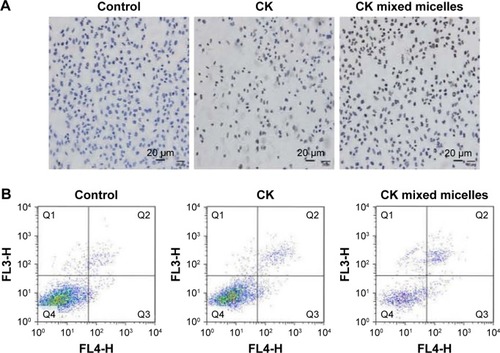
Figure 5 The uptake (A) and location (B) of PC/DP micelles observed in A549 cells. The tumor targeting effect of PC/DP micelles obtained in vivo (C).
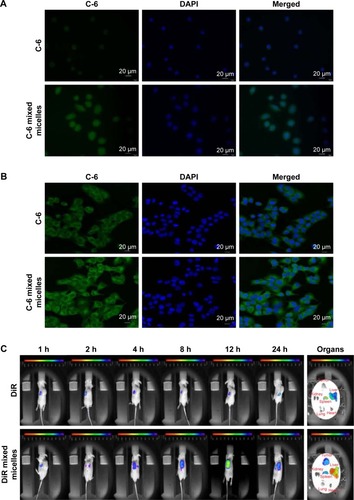
Figure 6 The relative tumor volumes (A), tumor images (B), and body weights (C) of mice for each group.
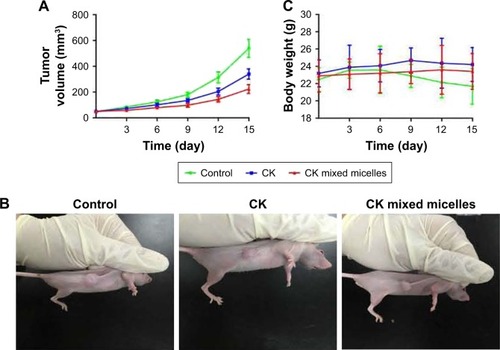
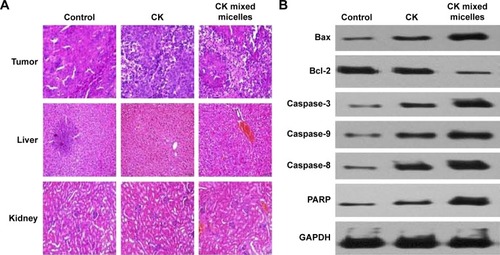
Figure 7 Hematoxylin and eosin-stained tumor, liver, and kidney tissue after micelle treatment of mice (treatment every third day for 15 days) (A). Apoptosis protein expression in tumor tissues (B).