Figures & data
Table 1 Primers used for real-time PCR
Table 2 Surface roughness of nanostructured Ti surfaces
Table 3 Elements composition of nanostructured Ti surfaces
Figure 1 Surface characterization of nanostructured Ti surfaces.
Notes: (A) Representative atomic force microscopy images showing the topography of the polished Ti (P) and nanostructured TiO2 NT surfaces via anodization at 5 or 20 V (NT5 and NT20, respectively) TiO2 surfaces. Scanning range=500×500×50 nm. (B) Representative field emission scanning electron microscopy images showing the morphology and topography of P, NT5, and NT20 surfaces from the vertical and lateral views (insets). Magnification=100,000×; scale bar=100 nm. (C) Representative images showing the water contact angle on modified Ti surfaces. Scale bar=1 mm; (D) contact angle analysis. *p<0.01 vs P; #p<0.01 vs NT5.
Abbreviation: NT, nanotubular.
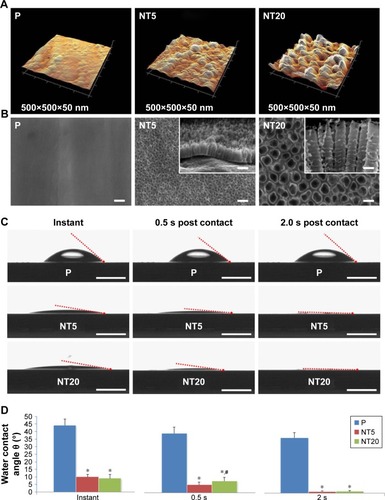
Figure 2 Morphology of LS-8 cell attachment on nanostructured Ti surfaces in standard or retinoic acid (RA) medium.
Notes: (A and C) Representative images showing the morphology of LS-8 cells attached to the prepared Ti surfaces in standard or RA medium. Magnification=400×; scale bar=50 μm. (B and D) Image semi-quantitative analysis of attached LS-8 cells in standard or RA medium. *p<0.01.
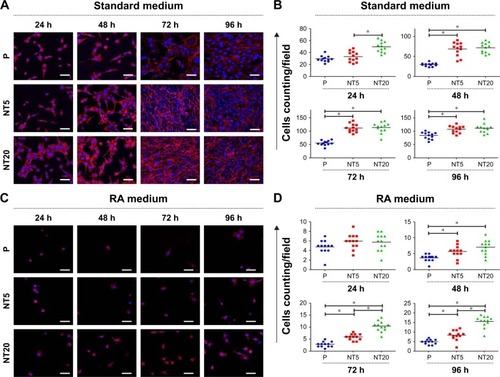
Figure 3 Proliferation of LS-8 cells cultured on nanostructured Ti surfaces in standard medium (A) or RA medium (B). *p<0.01 vs P; #p<0.01 vs NT5.
Abbreviation: RA, retinoic acid.
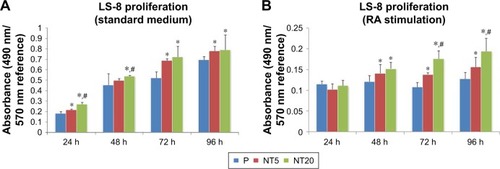
Figure 4 Apoptosis/necrosis of LS-8 cell on nanostructured Ti surfaces in standard or RA media.
Notes: (A) Representative images of flow cytometry; (B) analysis of the proportion of viable cells (upper row), apoptotic cells (middle row), and necrotic cells (lower row). *p<0.01.
Abbreviation: RA, retinoic acid.
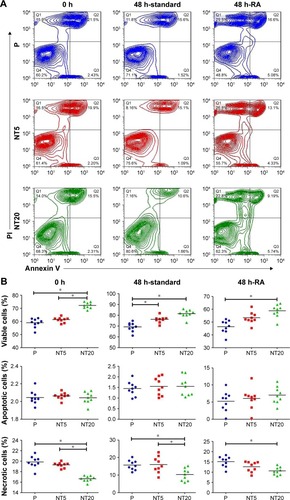
Figure 5 Expression of amelogenic genes in LS-8 cells cultured on nanostructured Ti surfaces in standard culture medium.
Notes: (A) BMP-2, (B) RUNX2, (C) SHH, (D) AMELX, (E) AMBN, (F) ENAM, (G) KLK4, (H) MMP-20, and (I) ODAM. *p<0.01 vs P; #p<0.01 vs NT5. Dotted line, gene expression of LS-8 cells on culture plate.
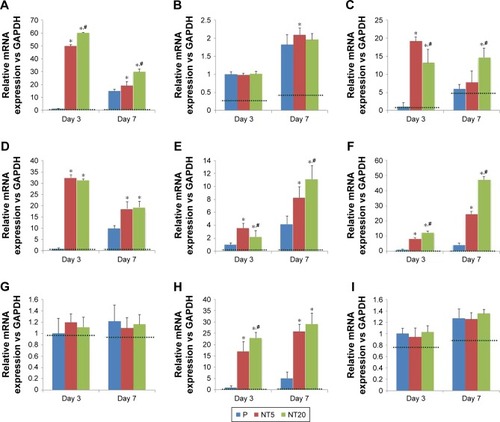
Figure 6 Expression of amelogenic genes in LS-8 cells cultured on nanostructured Ti surfaces with RA medium pretreatment.
Notes: (A) BMP-2, (B) RUNX2, (C) SHH, (D) AMELX, (E) AMBN, (F) ENAM, (G) KLK4, (H) MMP-20, and (I) ODAM. *p<0.01 vs P; #p<0.01 vs NT5. Dotted lines, gene expression of LS-8 cells on culture plate.
Abbreviation: RA, retinoic acid.
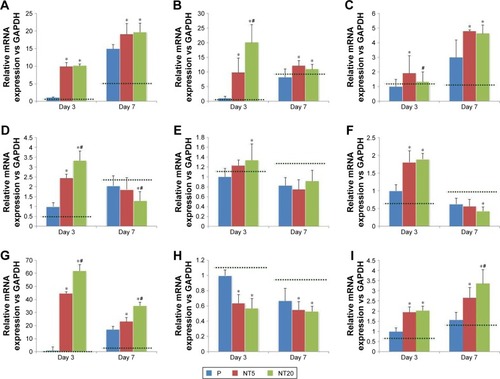
Figure 7 Extracellular matrix (ECM) mineralization of LS-8 cells on nanostructured Ti surfaces in standard or RA medium.
Notes: (A) Alkaline phosphatase (ALP) synthesis on modified surfaces in standard medium (upper row) and RA medium (lower row). (B) The formation of mineralized nodules on modified surface in standard medium (left column) and RA medium (right column), with the semi-quantitative analysis (C). Magnification=100×; scale bar=400 μm. *p<0.01.
Abbreviation: RA, retinoic acid.
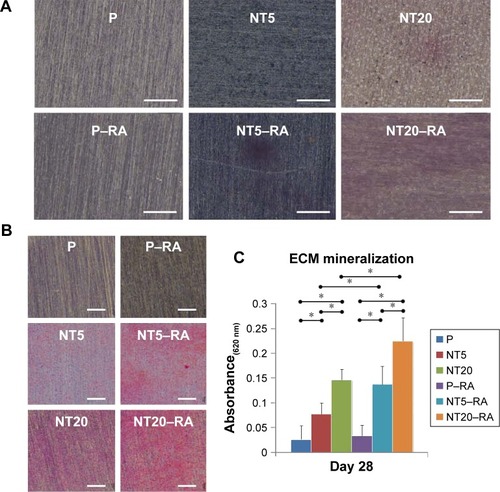
Figure S1 Elements analysis on nanostructured Ti surfaces via X-ray photoelectron spectroscopy (XPS) scanning.
Abbreviation: CPS, counts per second; ev, electron volt.
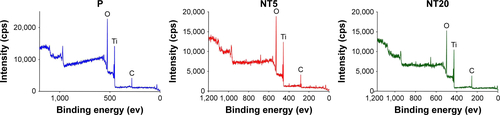
Figure S2 Morphology of LS-8 cells cultured on nanostructured Ti surfaces in standard medium (A) and RA medium (B), the arrows indicate pseudopods of LS-8 cells. Magnification=400×; scale bar=25 μm.
Abbreviation: RA, retinoic acid; P, polished Ti surface.
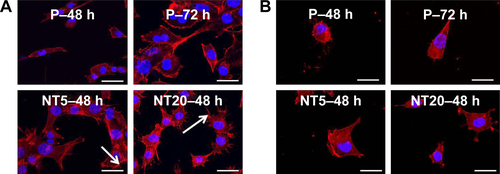
Figure S3 The apoptosis-related genes expression of LS-8 cells on nanostructured Ti surfaces in standard medium and RA medium at 24 and 48 h. (A) BAX, (B) BCL-2, and (C) CASP3. *p<0.01.
Abbreviation: NS, no significance.
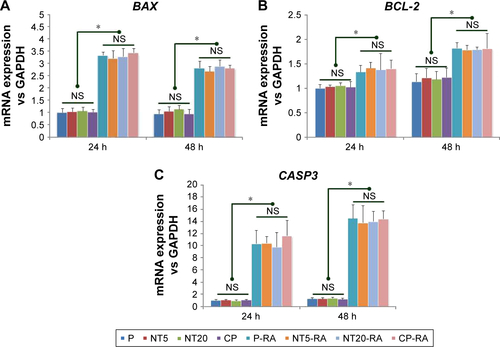
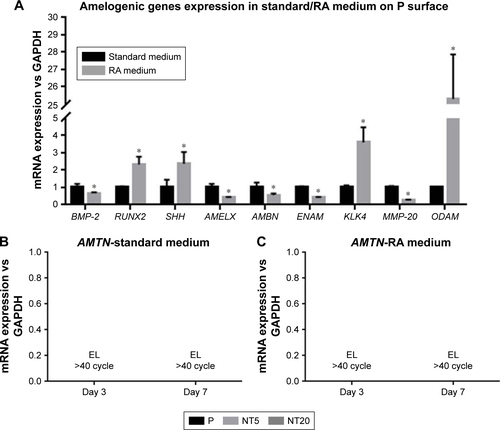
Figure S4 The alternation of amelogenic genes expression in LS-8 cells in response to RA medium 48-h pretreatment: (A) amelogenic genes expression on polished Ti surface in presence/absence of RA medium. (B) AMTN expression on nanostructured Ti surfaces in standard medium. (C) AMTN expression on nanostructured Ti surfaces with RA medium pretreatment. *p<0.01.
Abbreviations: EL, extremely low level; RA, retinoic acid.