Figures & data
Figure 1 Images of Fe3O4-TiO2 NPs and TiO2 NPs captured by TEM and HRTEM.
Notes: (A) TEM of Fe3O4-TiO2 NPs; (B) HRTEM of Fe3O4-TiO2 NPs; (C) TEM of TiO2 NPs.
Abbreviations: HRTEM, high-resolution TEM; NPs, nanoparticles; TEM, transmission electron microscopy.
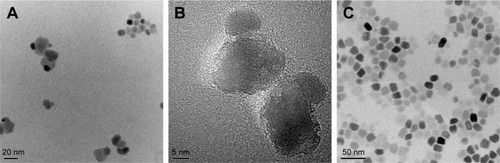
Figure 2 Fe3O4-TiO2 NPs captured by X-ray diffraction.
Abbreviation: NPs, nanoparticles.
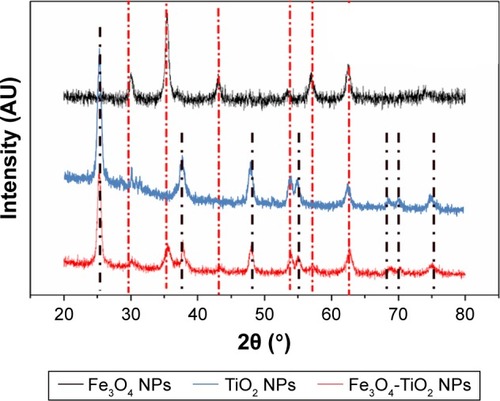
Table 1 Organ weight:body weight coefficients of rats after 30 days’ exposure to Fe3O4-TiO2 NPs or TiO2 NPs through intravenous injection
Table 2 Hematological analysis after different treatments
Table 3 Biochemical analysis of liver, renal, and lipid profiles
Figure 3 Ti content in tissue of rats after treatment with Fe3O4-TiO2 NPs and TiO2 NPs.
Note: **P<0.01, ***P<0.001 compared with control.
Abbreviations: NPs, nanoparticles; Con, control.
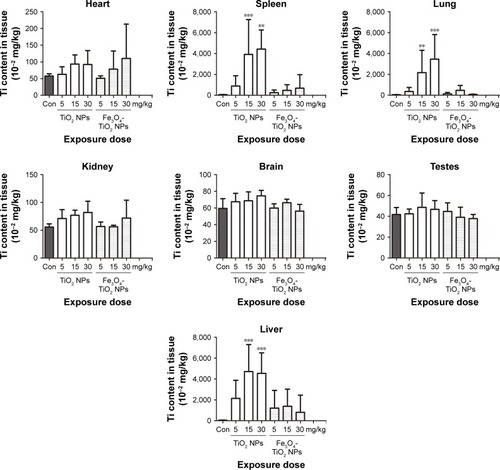
Figure 4 Fe content in tissue of rats after treatment with Fe3O4-TiO2 NPs or TiO2 NPs.
Abbreviations: NPs, nanoparticles; Con, control.
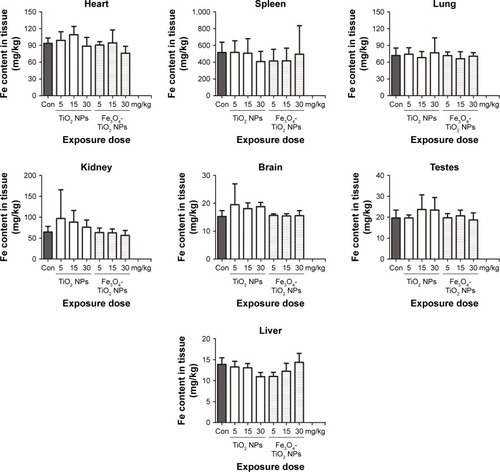
Figure 5 Photomicrography of liver histopathology.
Notes: Images (magnification 10×) represent histopathological sections of the liver. Arrows represent small focal-like inflammatory cell infiltration around the hepatic portal (HP) area in the 5 mg/kg TiO2 NP group and around the hepatic vein (HV) in the 15 mg/kg TiO2 NP group, and lymphocyte aggregation in the 30 mg/kg TiO2 NP group. Dark arrows represent liver hepatocyte (H) granule degeneration and small stove liver-cell shrinkage in both Fe3O4-TiO2 NP and TiO2 NP groups at 30 mg/kg.
Abbreviations: NPs, nanoparticles; Con, control; S, sinus; K, Kupffer cells.
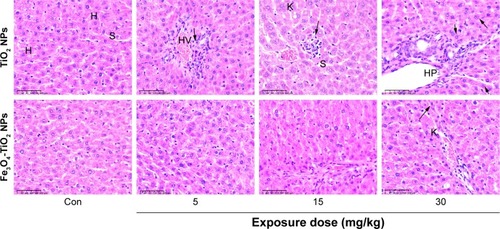
Figure 6 Photomicrography of lung histopathology.
Notes: Images (magnification 10×) represent histopathological sections of the lung. Dark arrow in the 15 mg/kg TiO2 NP group represents edema and exudation around bronchi and a large amount of inflammatory cell infiltration. Dark arrows in the 30 mg/kg TiO2 NP group represent a large number of inflammatory infiltration around bronchi.
Abbreviations: NP, nanoparticle; Con, control; A, alveolar space; B, bronchioles; H, histiocytes; AS, alveolar septa; V, veins.
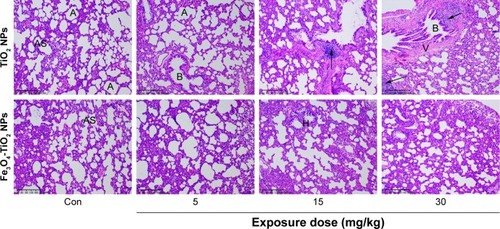
Figure 7 Photomicrography of spleen histopathology.
Note: Images (magnification 10×) represent histopathological sections of the spleen.
Abbreviations: NPs, nanoparticles; Con, control; RP, red pulp; WP, white pulp; T, trabeculae; CA, central artery; GC, germinal center.
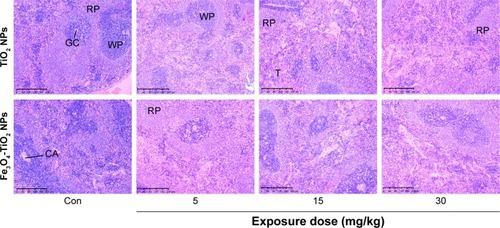
Figure 8 Photomicrography of kidney histopathology.
Notes: Images (magnification 40×) represent histopathological sections of kidneys. No significant pathological changes were observed in the hearts in either Fe3O4-TiO2 NPs or TiO2 NPs treated animals (data not shown).
Abbreviations: NPs, nanoparticles; Con, control; G, glomerular; T, tubular epithelial cells.
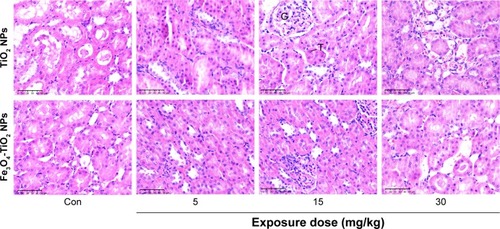
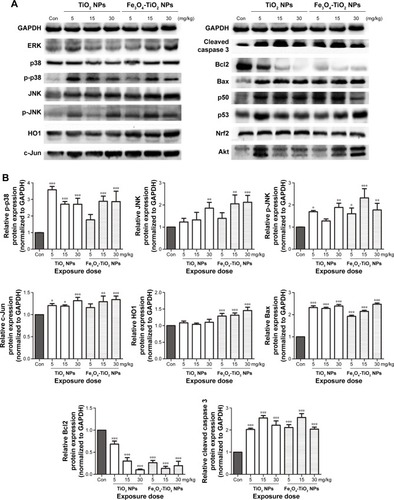
Figure 9 Signal protein expression in liver tissue.
Notes: (A) Protein-expression levels of p38, p-p38, JNK, p-JNK, HO1, ERK, c-Jun, cleaved caspase 3, Bcl2, Bax, p50, p53, Nrf2, Akt, and GAPDH; (B) relative protein expression (normalized to GAPDH). *P<0.05, **P<0.01, ***P<0.001 compared with control.
Abbreviations: NPs, nanoparticles; Con, control.